
Post login, the dashboard is the default landing page for all the users. On the dashboard the following default metrics are provided:
- Seqrite Malware Analysis Platform (SMAP)
- Command Center
Seqrite Malware Analysis Platform (SMAP) Metrics
Seqrite Malware Analysis Platform metrics are used to evaluate and classify malicious samples. They
help to understand malware behavior, detect threats, and improve security.
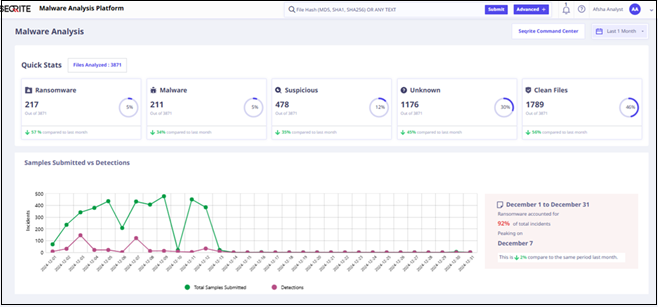
The dashboard shows following SMAP metrics:
| Metrics | Description |
| Quick statistics of analyzed file | It shows the bifurcation of analyzed files. |
| Samples Submitted vs Detection | It shows the total number of files submitted and detection. |
| Top malware categories | It shows the top malware categories along with their respective count. |
| Top Malicious File Types | It shows the top malicious files, sample submitted to analyze, number of detections, and detection percentage. |
| Submission Methods and Top source contributing to detection | It shows the number of manual and auto submission of files, and top sources contributing to detection. |
| Top Malware Families Detected | It shows the top malware families along with their name, category, detection rate and detection date. |
| Trending Tags in Malware Analysis | It shows the top trending tags. |
Command Center
Command Center projects insights from Seqrite’s telemetry, which is gathered from our 10 million
endpoints.
Accessing Command Center
To access and view the command center, click the Seqrite Command Center on top right of the dashboard. The following are the key metrics on the command center:
| Metrics | Description |
| Endpoints (Total active and Protected endpoints) | It shows the number of devices where Quick Heal antivirus is installed and among them how many endpoints were recently protected from threats. |
| OS wise protected end points | It shows operating system wise protected end points numbers. |
| Top targeted states/cities | It shows the top 10 targeted cities and states by the number of detections. |
| Top targeted industries | It shows the top 10 target industries by number of detections. |
| Top Attacking Remote IPs | It shows the number of malicious active remote Ips. |
| Top Ransomware families | It shows the top 10 active ransomware families. |
| Top Vulnerabilities | It shows the top 10 detected vulnerabilities. |
| Threat Map | It is a visual representation of cyber threats across India. |
User Profile
The User Profile section on the upper-right corner of the dashboard shows the name of the registered user. When you click the logged-in username, the options displayed are, screen appearance that is Dark Theme and Light Theme, Role, API Key,Support, list of the open-source tools/library and licenses under About, and Logout.