
The dashboard is the default page that is displayed after you log on to the Seqrite Threat Intel portal. The dashboard helps to navigate easily to all the features or components of the Seqrite Threat Intel portal.
Dashboard Metrics
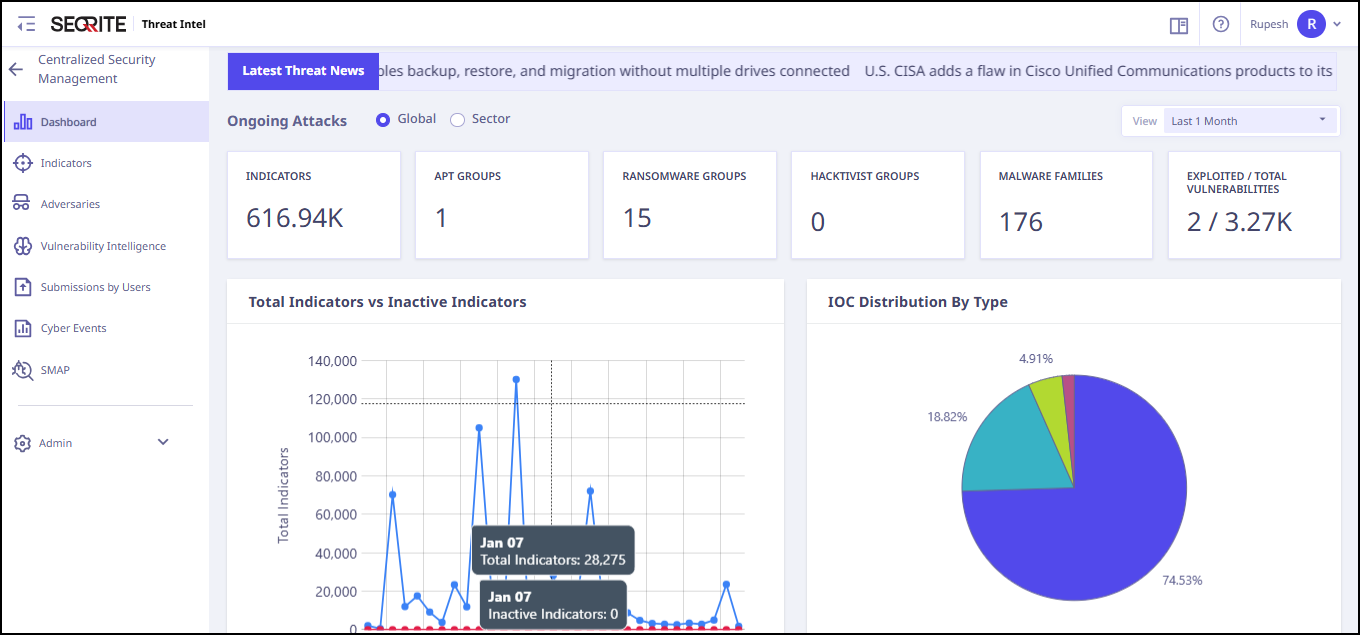
The dashboard gives a glimpse of predefined metrics related to Indicators of Compromise (IoC). Some (not limited to) pre-defined metrics are as follows.
| Section | Description |
| Latest Threat News | Display all the latest Cyber Threat news reported from reputed and reliable sources. |
| Quick Statistics | Statistics on the Reported Indicators, APT Groups, Hacktivist Groups, Ransomware Groups, Exploitable CVEs. |
| Total Indicators vs Inactive Indicators | Timeline view of all reported active Indicators vs Inactive Indicators. |
| IoC Distribution by Type | It shows the breakdown of IoC by categories such as IPs, domains, or files. |
| IoC Risk Score Distribution | It gives visual representation of risk levels (low, medium, high) for detected IoC. |
| Most Active indicator Tags | Gives the type and count of the most active malware categories. |
| Top Products affected by CVEs | List of Products / applications which are most exploited by their vulnerabilities. |
| CVE Distribution by Severity | Distribution of all reported vulnerabilities based on their CVSS score as Critical, High, Medium and Low. |
| APTs (Advanced Persistent Threats) | APTs (Advanced Persistent Threats). Shows the top 10 active most targeted by APTs, top 10 sectors most targeted by APTs, and their top 10 victim distribution across globe. |
| Ransomware | Displays the top 10 Ransomware Groups, top 10 sectors targeted by Ransomware, and their top 10 victim distribution across the globe. |
| Hacktivist | Displays top 10 targeted Hacktivist, top 10 sectors targeted by hacktivist, and their top 10 victim distribution across the globe. |
| Malware | Displays top 10 trending malware category, top 10 trending malware families, and malware threat activity. |
| Top 10 Organizations targeted by Adversaries | Top 10 Organizations which are targeted by Adversaries. |
| Top 10 Sectors targeted by Adversaries | Top 10 Sectors which are targeted by Adversaries. |
| Top 10 Adversary Techniques | Top 10 techniques used by Adversaries to carry out a Cyber-attack. |
| Latest Adversaries | Shows recently active or newly observed threat actors. |
All the above metrics on the Dashboard can be filtered to view Global Intel or Sector specific Intel.
User Profile
The User Profile section on the upper-right corner of the dashboard shows the name of the registered user.
When you click the logged-in username, the options are displayed: Role, View Profile (First Name, Last Name, Email, Organization and Sectors –sectors associated with your organization), Support, About, Change Password, and Logout. You can also switch between Dark and Light themes by clicking the corresponding theme icons.
Glossary
Glossary provides clear definition of key terms and phrases used throughout the Seqrite Threat Intel. It helps users to understand words and concepts related to cyber threats, attacks, and security.