You can create a new query with required indicators and apply the query to get results or you can use previously saved queries to search for threats in the Seqrite EDR database.
- On the Seqrite EDR portal, click the Threat Hunting page in the left navigation pane.
- Click Add+. The queries filter dialog is displayed.
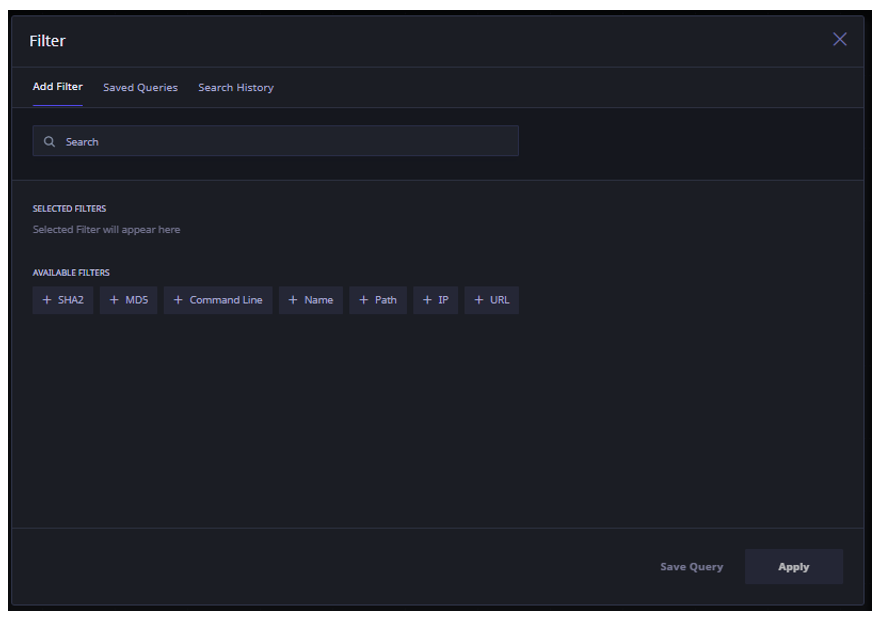
- Create a new query or click the Saved Queries tab to view the Saved Queries and select the query that you want to run. For this example, we click on Saved Queries tab and select the first query in the list.
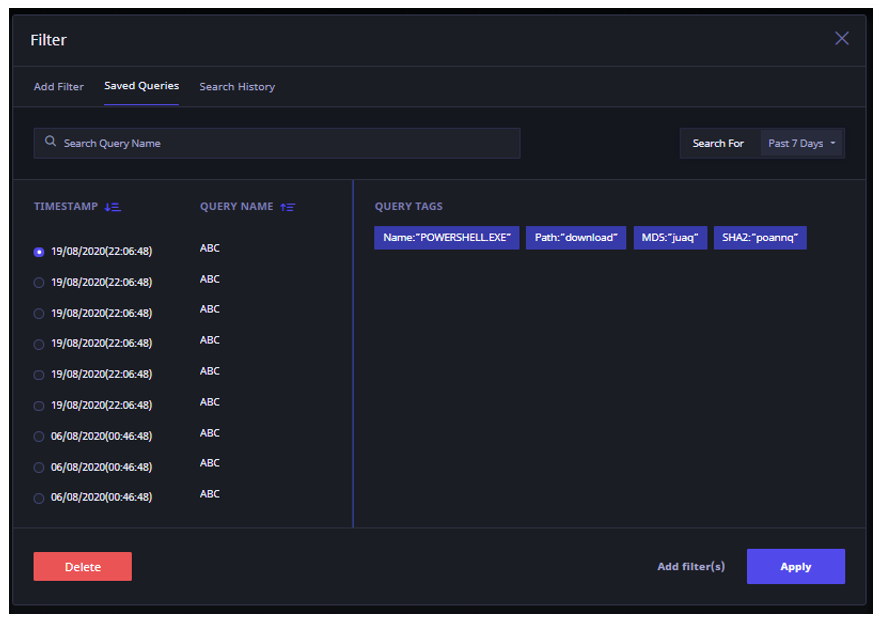
- Click Add Filters, to add/modify and filters in the selected query.
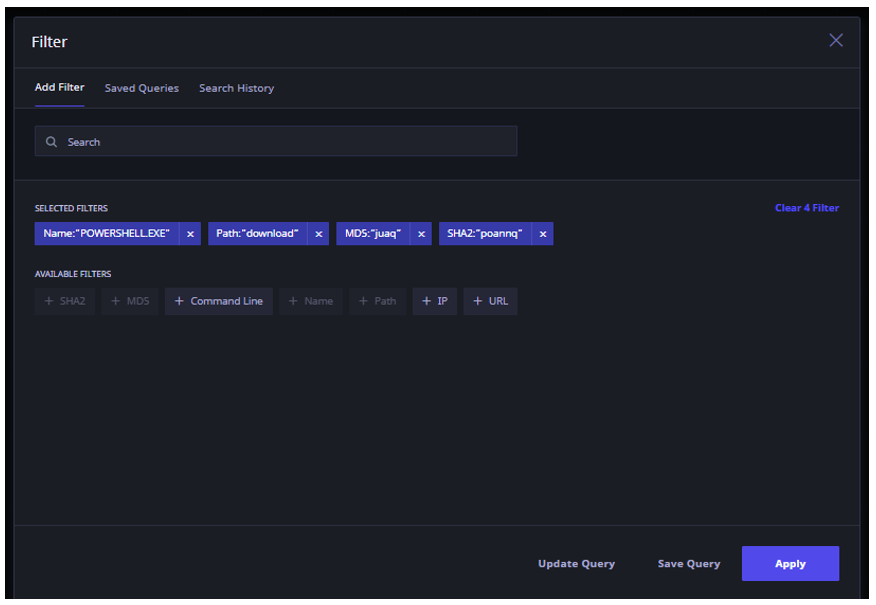
- As a result of previous action, some indicator filters are displayed. Add or remove the indicator filters as required.
- Click Apply to run the final query. The results are displayed in the Canvas mode with the corresponding host nodes highlighted in blue on the canvas.
The right pane displays the corresponding processes that match the query.
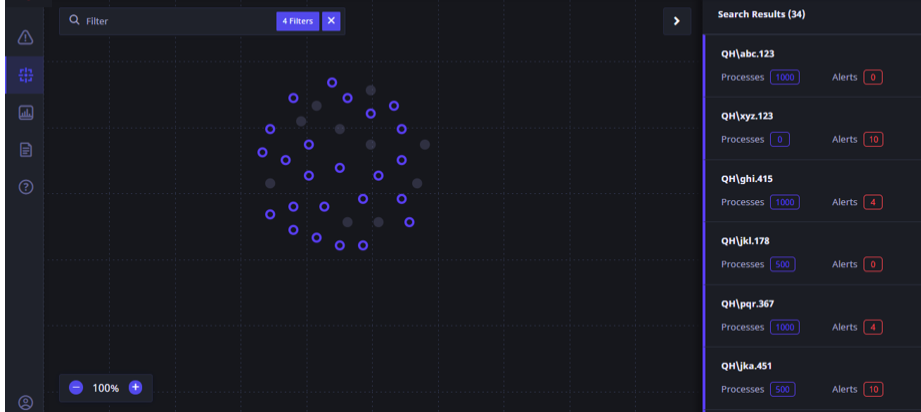
- To obtain more information about a particular host, click the Host node. Each small dot or node represents a host endpoint.
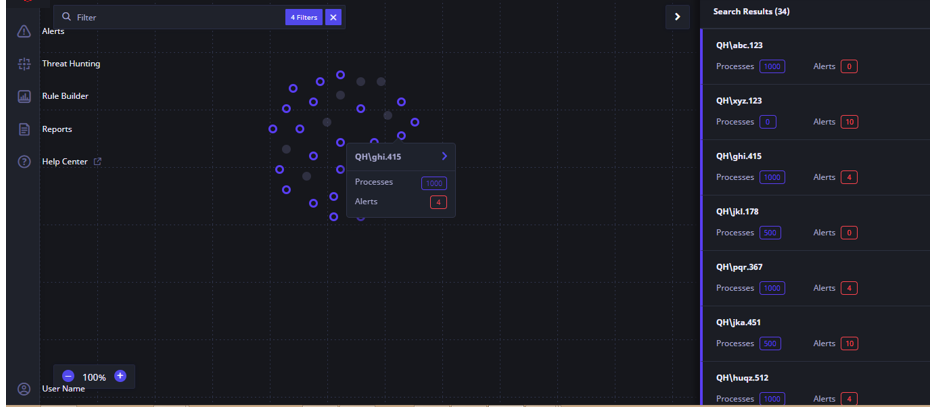
Alert details and process details for that host are displayed in a small box with number or processes and alerts. Alternatively, you can click the corresponding entry in the right pane to get more information on that host.
The following information is displayed about the selected alert:
- Corresponding hostname
- Severity of the alert
- Date and time of the affected file
- Attack tactic type
- Status of the alert whether open or closed
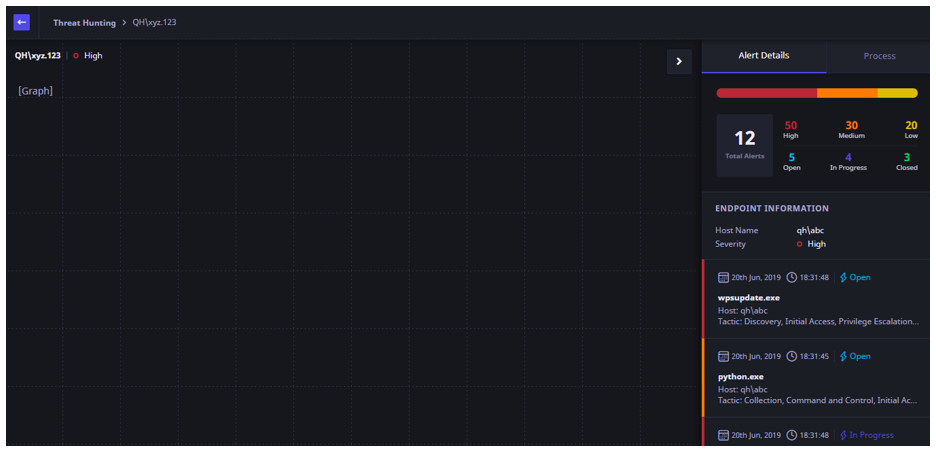
- To view the Process details for that host, click the Process tab on the upper right corner. The details for only the processes on the host that match the query are displayed.
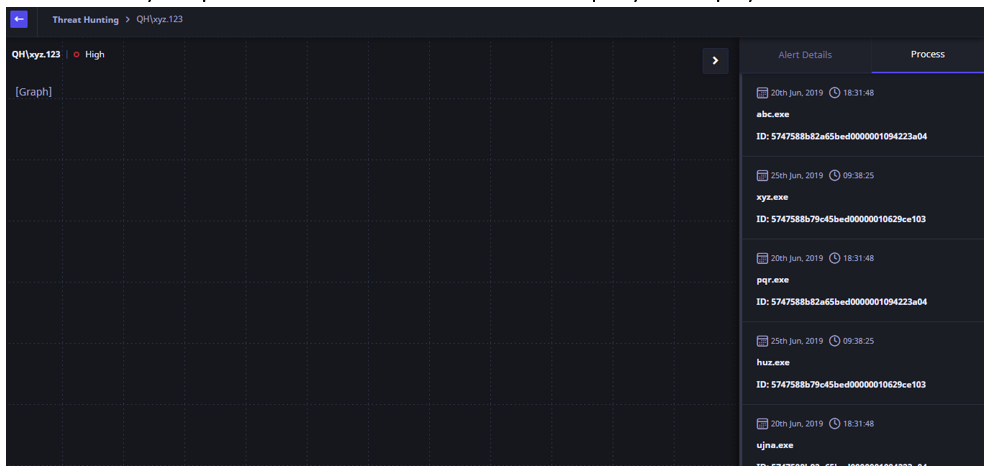
- To start the investigation for a process, click the particular process. The user is navigated to the Alert/Process analysis page from where the user can start the investigation workflow.

