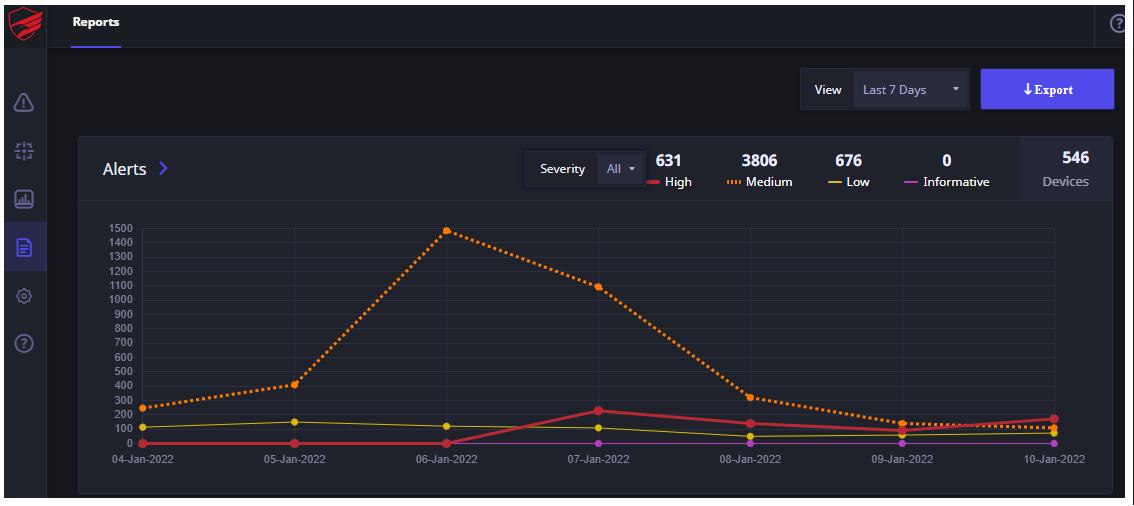
The first widget gives information about the number of Alerts and severity over a 7, 15, or 30 day -period on a line chart. The count by severity and total number of devices/endpoints is displayed in upper right corner. Use the Severity filter to display the alerts by severity as required.

Tip: You can navigate directly to the Alerts page with the filter that is applied by clicking the forward facing caret highlighted in yellow as shown below.


