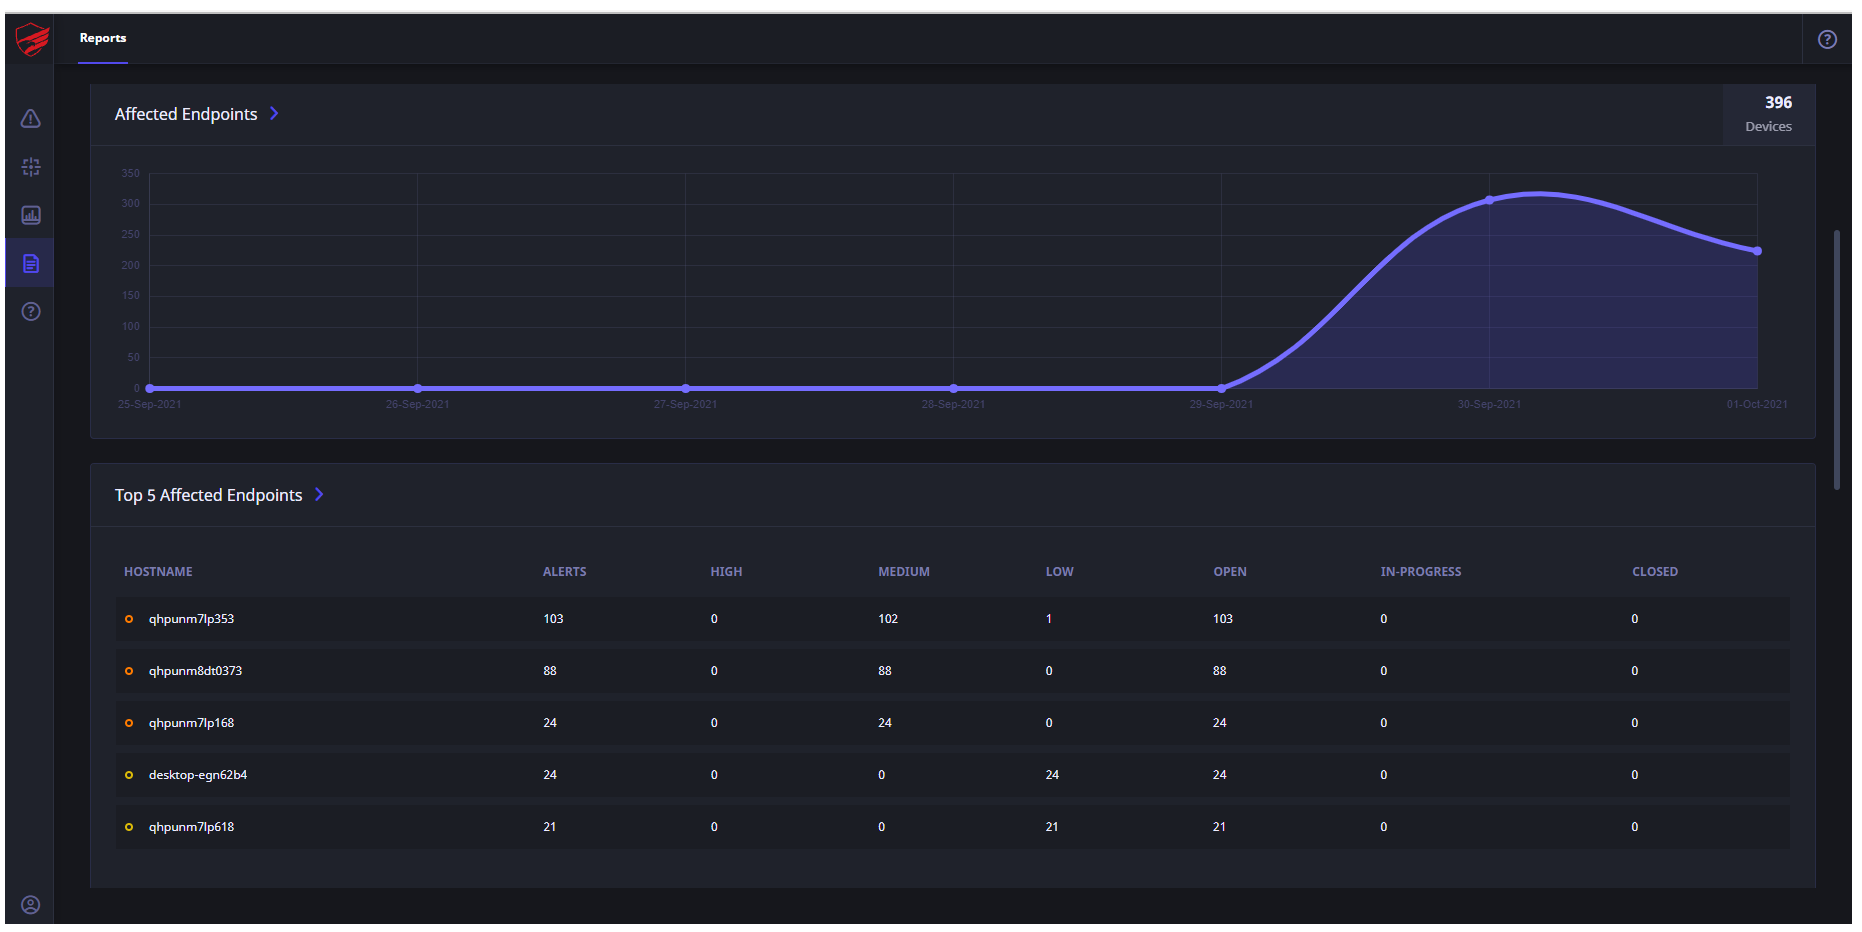
The second part has two widgets as follows: One gives information about the count of affected endpoints over a 7-day period.
The second widget gives other information about the top 5 affected endpoints along with the Hostname. A table in the widget displays the count of alerts based on their current status and severity for respective host.


