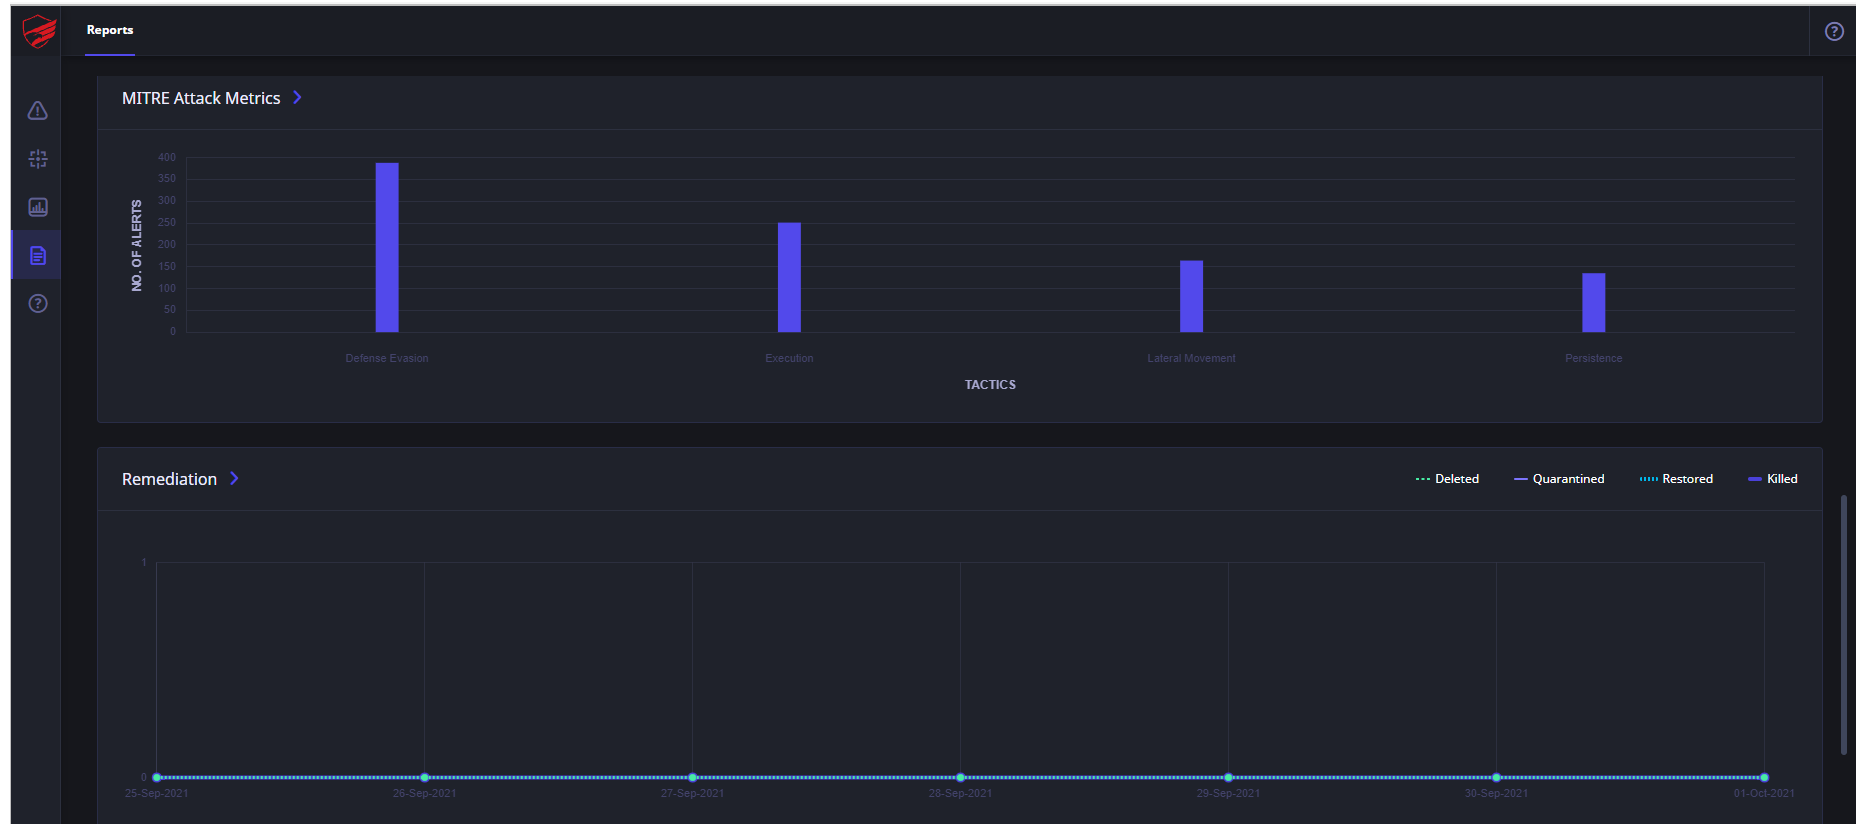
In the third part, in the first widget, information about MITRE attack Metrics, the count of alerts by attack type are displayed in a bar graph on the left.
In the next widget, towards the right side, counts for remediation by Delete or Kill action are displayed date-wise for the past 7 days.
The Total count for devices is displayed in upper right corner. Hover above each graph to view Remediation activity counts for that date.


