Alert analysis – Remediation actions
On Endpoint
During Alerts analysis, if you find any endpoint is running malware, you can perform the following remediation actions on that endpoint.
The endpoint isolation and restore feature allows IR to isolate the endpoint from the network when an endpoint is running malware, to ensure the malware doesn’t spread to other endpoints.
When the endpoint is isolated, IR runs an investigation and resolves security issues. Once the endpoint is clean, IR can reconnect the endpoint to the internet.
- Isolate: This action will isolate the endpoint from the network. This action will ensure that the malware is not spread in the network. This option is available only if the endpoint is infected. After isolation, IR runs an investigation and resolves security issues.
- Reconnect: This action will reconnect the endpoint to the network. Once the endpoint is clean, IR can reconnect the endpoint to the network with this action. This option is available only if the endpoint is isolated.
On File
During Alerts analysis, if you find any suspicious file activity, you can perform the following remediation actions on that file.
Note: Kill option will be displayed only for executable files in addition to Quarantine and Restore options. For other files, Quarantine and Restore options will be displayed.
On Registry entries
From the alert, you can navigate to the process file that has spawned the regedit.exe file which is used to create/edit entries in the system registry. Clicking on the Values Created will display the registry entries in the right pane.
For any registry keys that are created as a result of any suspicious activity, you can select the registry keys and click Delete.
Note: You may not be able to delete a registry entry that has been renamed, or deleted already.
Switching from Timeline View to Type View
This view lets you view the Alert analysis for a host in terms of types of activities triggered by the process. These can be file actions, process, network or Registry type.
- You (IR) are currently on the Timeline view for Alert analysis on a host.
- Click the Type view. The Type view is displayed for the same alerted process as follows:
The details for the alert are displayed in types. Here we can see that the file WMIC.exe has triggered 39+ File activities and 1 other process.
- Click the + sign besides File to view the related details.
Activating the Date and Time View
You can view the progression of the process that triggered an alert on a date and time scale. This scale also displays whether the activity was related to a Process, Files, Registry or a Network activity.
- To enable the Date and Time view, click the caret in the lower left corner (highlighted in a yellow square).
The Date and Time view is displayed with the activity type.
- Click the white caret in the lower left corner to close the Date and Time view.
Color Code Legend
| Color of dots | Activity related to |
|---|---|
| Yellow | Process |
| Purple | File |
| Blue | Network |
| Green | Registry |
Additionally, you can do the following:
- We can zoom in and out using mouse. We can adjust time window, if there are multiple events at same time, then there will be concentric circles on this view, else it will be a solid circle for a single event.
- Also, when user clicks on this solid circle on this view, then user can see respective event on tree as well as details on right side panel.
- When user clicks on concentric circles, then on right side panel all the concurrent events occurred at that same time are displayed. User can see further details of event by clicking on the events.
- View the time sequence of activities performed by a process or its parent or siblings during the course of an alert generation.
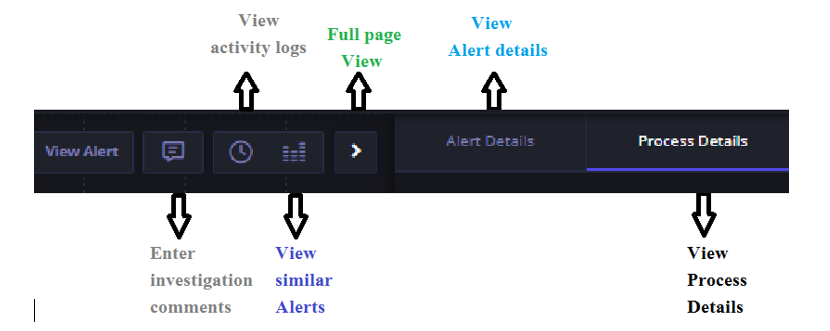
Other actions available on Alerts > Analysis workflow Page.
- You can avail the following functionality by clicking the designated buttons on upper right corner of the user interface.

| Functionality | Action |
| To return to the alert after you have traversed far into the analysis workflow. | Click the View Alert button. |
| To view the activity logs for an alert. | Click the clock icon. |
| To enter comments during analysis. | Click the comments box. |
| To view similar alerts on other hosts. | Click the Graph shaped corresponding icon. |
| To go to full view. | Click the white caret to expand the view to full page view. To return, click the inverted caret that is pushed to the far right. |
| To view the Alert details such as basic timestamp information, generated by which rule, and the status and severity of the alert and assignee. | Click the Alert Details tab. |
| To view the process details that triggered the alert such as process name, binary size and endpoint details. | Click the Process tab. |

