
The Analysis workflow helps the IR investigate the suspicious event(s) that generated the alerts. The Analysis workflow displays the processes that triggered the alert based on the corresponding rule. The first file that started the sequence of security events and the following processes are displayed in a collapsible tree like flow. Starting from the first process/file, clicking on an event displays the further events that occurred and the corresponding details. You can explore the process flow up to the last occurred event.
The following screenshots show, step by step, how an IR starts the analysis for an alert.
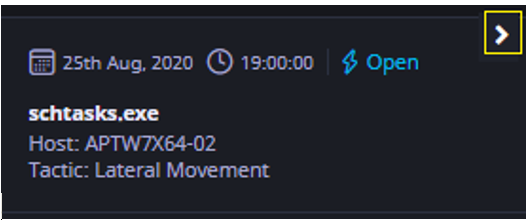
- First the IR opens the analysis workflow for an alert by clicking on the caret (highlighted in yellow square) on the upper-right corner of the alert in the Details pane. The Details pane is located below the Alerts dashboard.
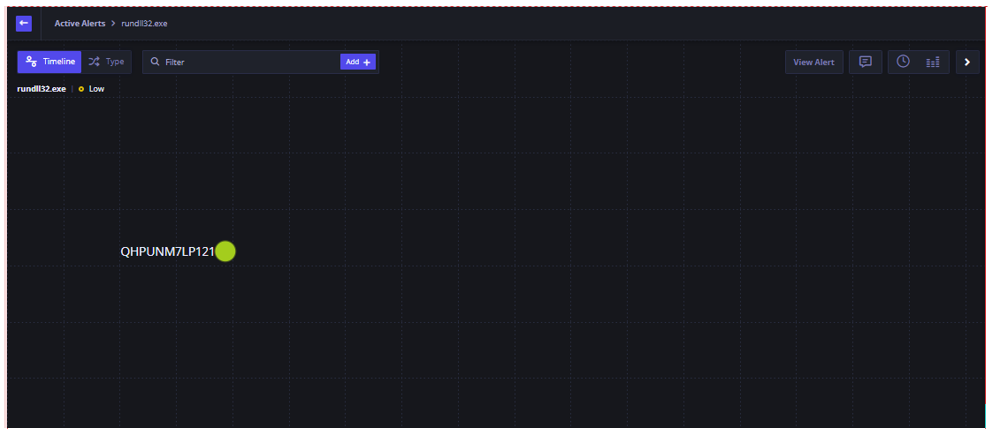
- IR then clicks on host QHPUNML7LP121 icon displayed on the screen.
- The filename rundl32.exe is displayed on the screen which further led to execution of some modules.
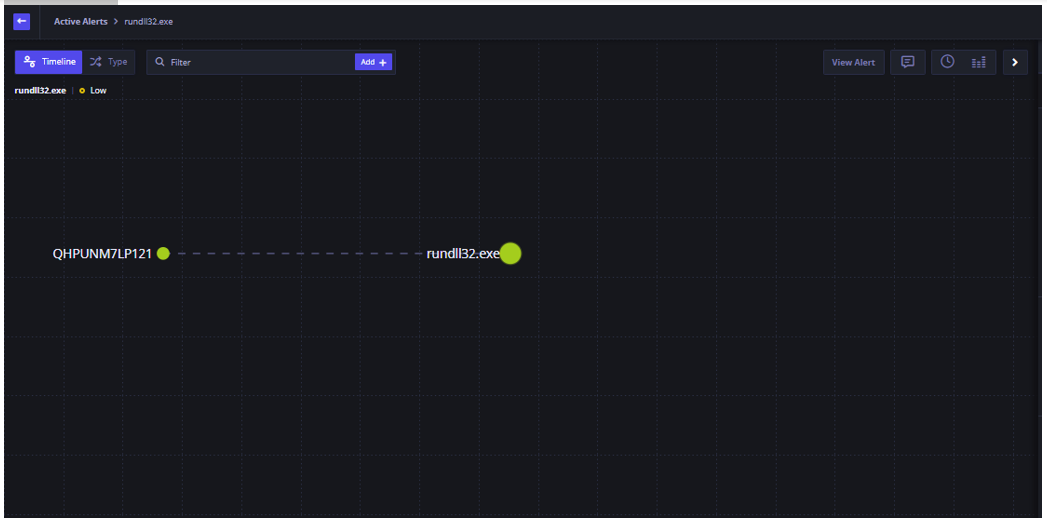
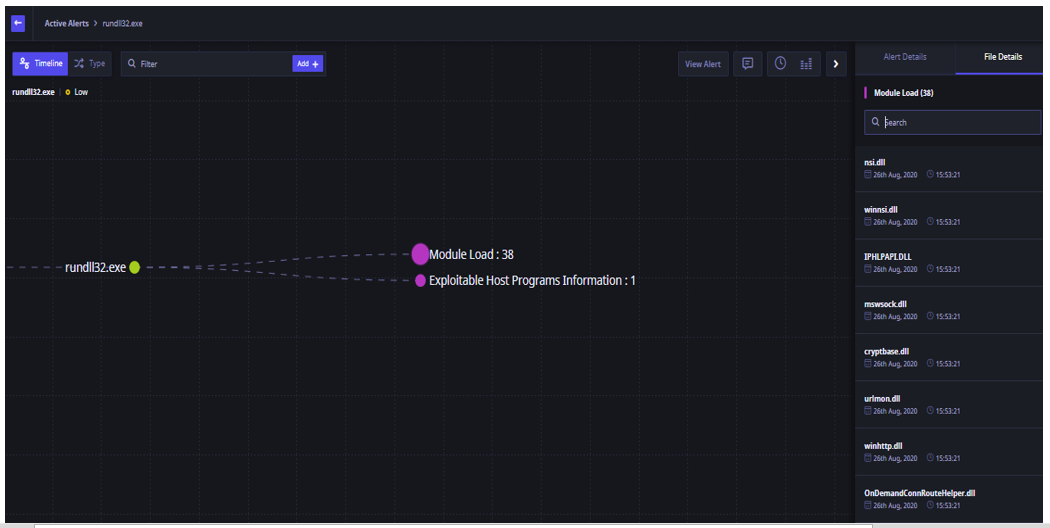
- To investigate further, the IR then clicks on rundl32.exe icon.
The screen displays the following:
— Count of modules that were loaded by the rundl32.exe executable and any exploitable host programs.
— The basic information for the process rundl32.exe, time of execution, start time, end time, path, MD5 count, SHA count, the command line, and the drive type is displayed.
–The binary information, and the endpoint details such as the Username, Hostname and the operating system on the host are displayed in the right pane.
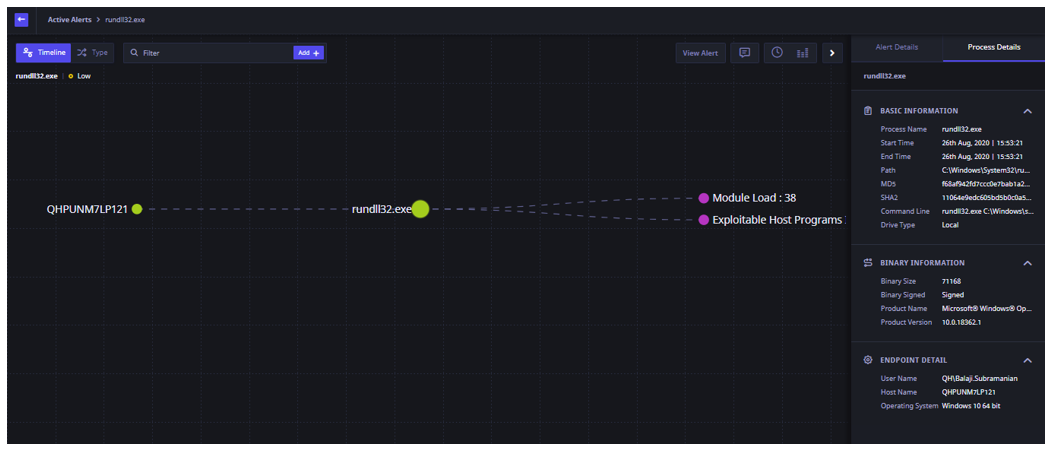
— The filename and time stamp details for the 38 modules that were loaded are displayed in the right pane.
— The screen also shows that the file rundl32.exe loaded on exploitable host program in memory.
This analysis can be followed further, right up to the last action that was initiated by the alerted process.