- Configuration of Forti Analyzer Connector.
- Under the connector, go to Ingestion.
- Select Event Connector. Click on Configure.
- Enter the collector Id and Password.
- Select the Validate and Save.
- Forti Analyzer Connector Requirement.
-
Machine with Static IP address allocation.
-
Install the docker engine from Get Docker.
-
systemctl start docker -
Collect the system IP address.
-
Opening the Port in the system for the Firewall.
-
For use in Linux and MAC
# Opening port in linux system firewall firewall-cmd --permanent --add-port=514/udp firewall-cmd --reload -
For Use in Windows, Open the Powershell command prompt.
# Opening port in Windows system firewall New-NetFirewallRule -DisplayName "Allow UDP Port 514" -Direction Inbound -Protocol UDP -LocalPort 514 -Action Allow New-NetFirewallRule -DisplayName "Allow UDP Port 514" -Direction Outbound -Protocol UDP -LocalPort 514 -Action Allow
-
-
Download the docker image tar file from given URL
https://connectors-xdr.seqrite.com/connectors/collector/download?collectorId=<created collector id>&password=<created collector password>&tid=<tenant-id> -
Load docker image
docker load --input <path to hhcollector-1.0.0.tar file> -
Start the agent using below command
docker run -p 514:514/udp --env COLLECTOR_ID=<created collector id> --env TID=<tenant id> hhcollector
- Forti Analyzer Configuration Requirement
-
The event collector is up and running.
-
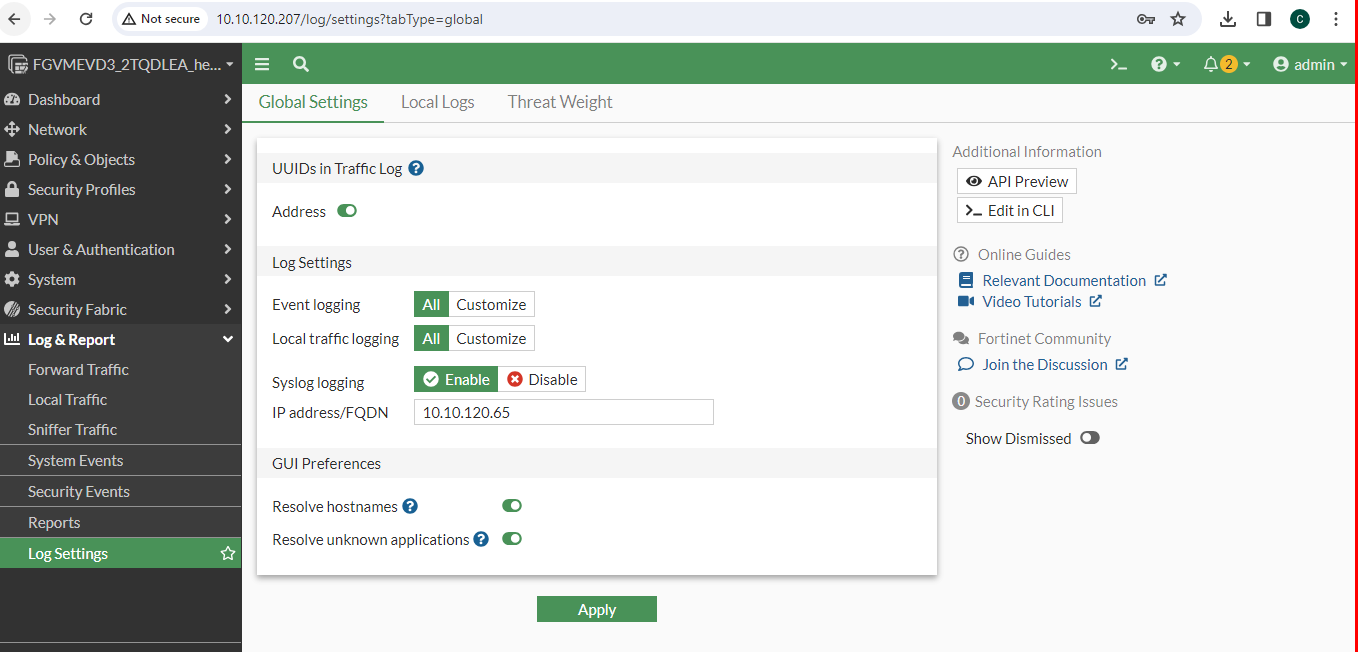
Go to FortiGate firewall interface. Go to Logs & Report > Log Settings. Under Global Settings, Enable Address, Event Logging, Local trafic Logging, Syslog Logging. Enter the IP address of the Forti Analyzer. Click on Apply.
-
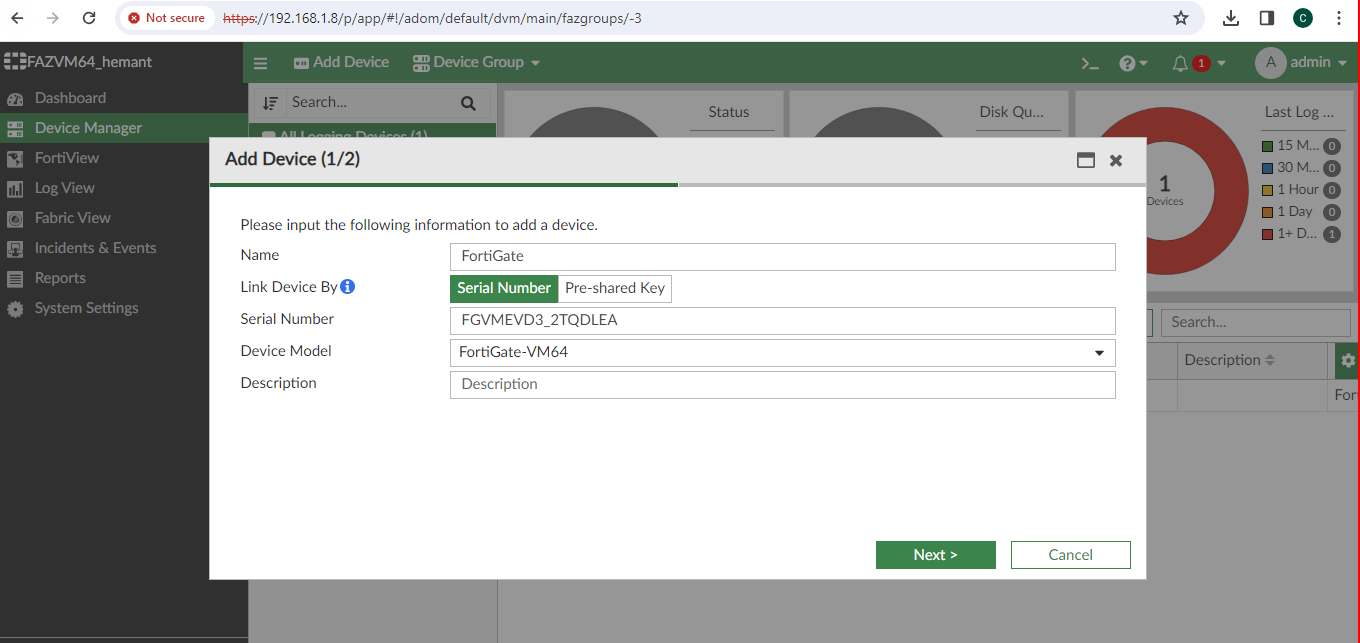
Go to FortiAnalyzer interface. Go to Device Manager. Click on Add Device, Enter the Name, Serial Number (FortiGate Firewall Serial Number). Click on Next and then Finish.
-
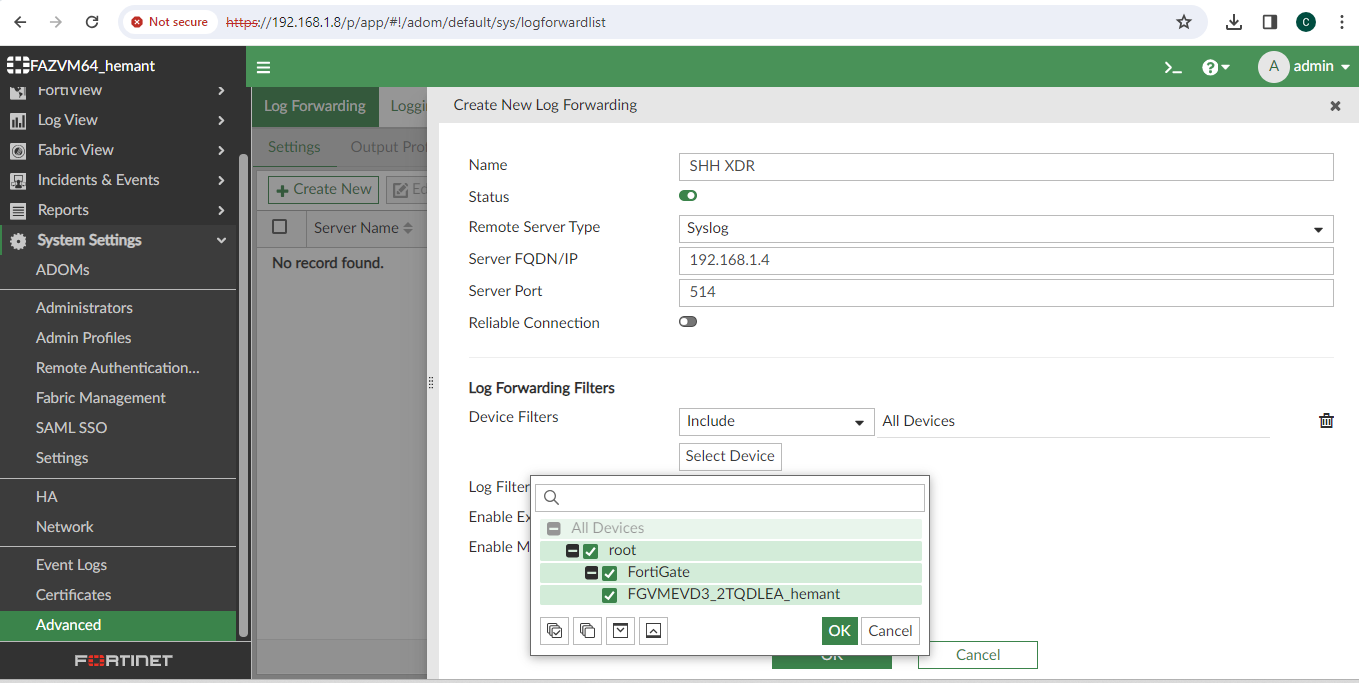
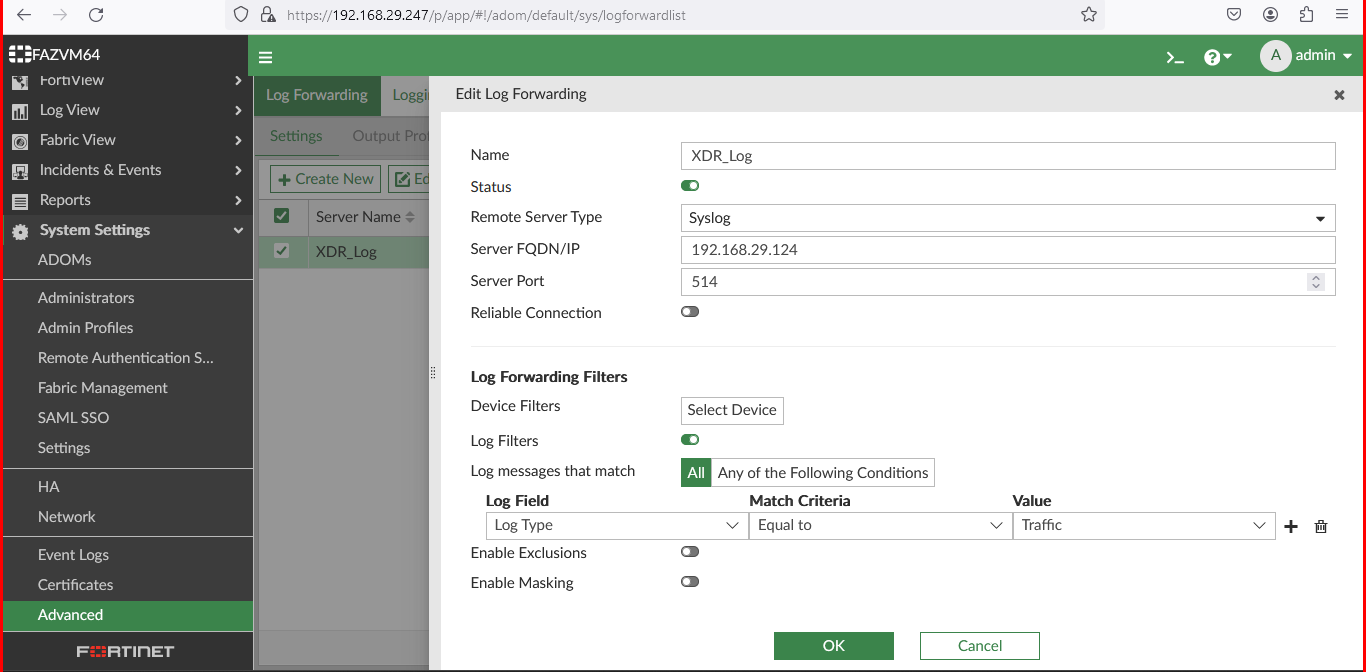
Go to System Services go to advanced and choose log forwarding setting. Under Syslog Server, Select Add. Set the event collector machine IP and UDP port 514 as target for syslog log forwarding.