
Overview
On this page, the administrator can view comprehensive information about active user sessions on the user portal, registered devices, applications, and policies in the form of infographics. This helps the administrator get an overview over all the activities related to the organizational applications and services. The following information is displayed on this page.
System Metrics Overview
The login metrics display the following widgets:
- Number of active sessions: Identifying the workload and resource utilization through the number of active sessions.
- Number of registered devices on which the ZTNA Agent is installed: Tracking the distribution and coverage of the ZTNA Agent by monitoring the number of registered devices.
- Number of failed login attempts: Assessing security threats and potential vulnerabilities by monitoring the number of failed login attempts.
- Number of applications not accessed by end users within a specific time frame: Evaluating user engagement and system performance by tracking the number of applications not accessed within a specific time frame.

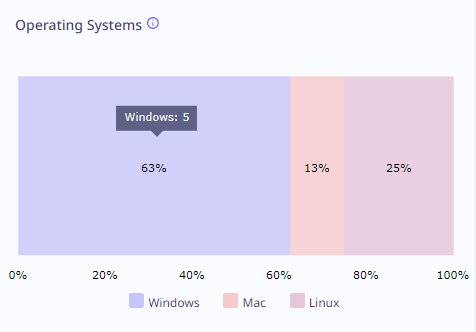
Operating Systems
This widget shows the count of distinct operating systems (Windows, MAC, and Linux) identified on devices where the ZTNA Agent has been installed. This count is regardless of the duration filter set.
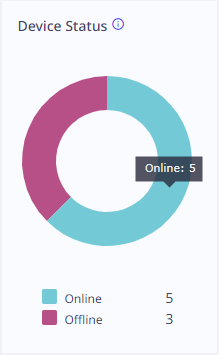
Device Status
This widget displays a doughnut chart that depicts the number of devices where the ZTNA Agent is installed. The chart categorizes the devices as either online or offline.
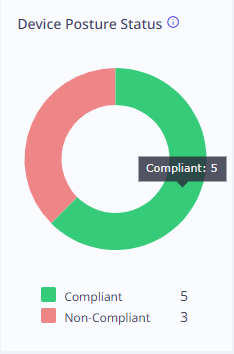
Device Posture Status
This widget displays a doughnut chart that depicts the number of devices that meet device posture rules as Compliant and the number of devices that do not meet the rules as Non-Compliant.
Blocked applications
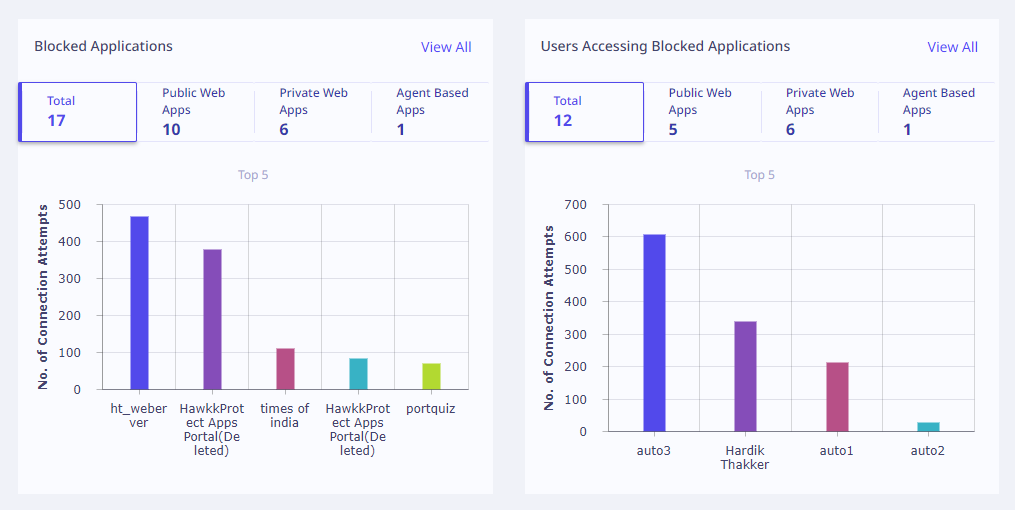
The widgets present the subsequent information.
| Field | Description |
|---|---|
| Total | Total number of blocked applications. |
| Public Web Apps | Number of blocked Public Web Apps. |
| Private Web Apps | Number of blocked Private Web Apps. |
| Agent Based Apps | Number of blocked Private Web Apps. |
| Graph | The graphical representation of the number of connection attempts for the top 5 blocked applications is displayed. |
Click View All to view the complete information about each of the blocked applications.
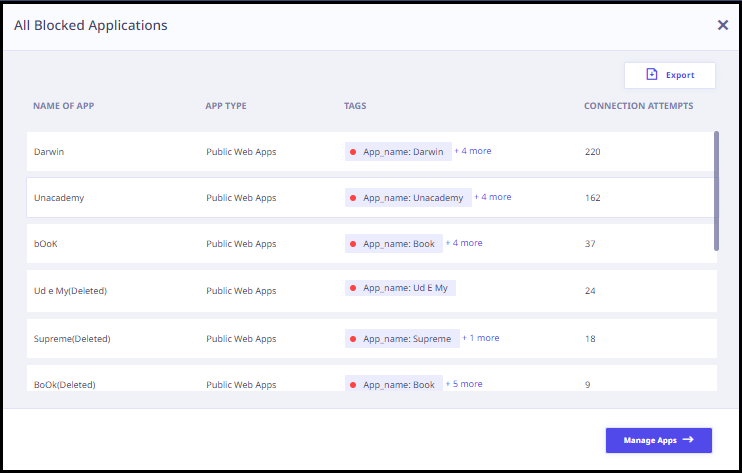
Actions available with blocked applications
| Field | Description |
|---|---|
| Export | To export these details in CSV format. |
| Manage Apps | To manage these applications. Clicking this button redirects you to the applications page. |
Users Accessing Blocked Applications
The widgets at the top display the following information.
| Field | Description |
|---|---|
| Total | Total number of users accessing blocked applications. |
| Public web apps | Number of users accessing blocked public web apps. |
| Private web apps | Number of users accessing blocked private web apps. |
| Graph | The graphical representation of the number of connection attempts for the top 5 users accessing the blocked applications is displayed. |
Click View All to view the complete information about each user accessing the blocked applications as follows.
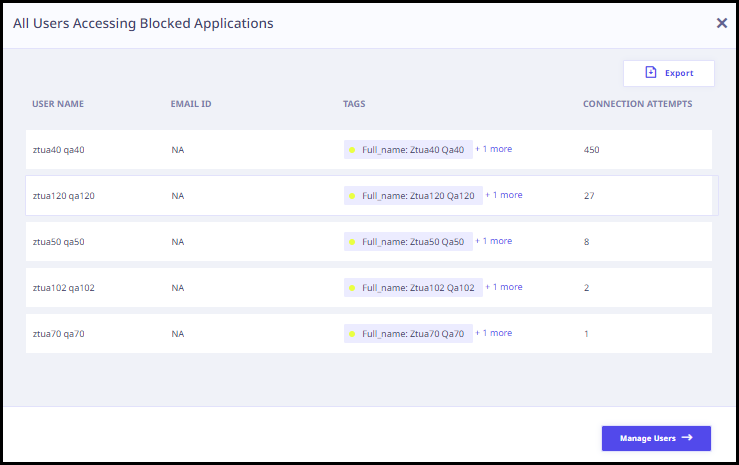
Actions available with users accessing blocked applications
| Field | Description |
|---|---|
| Export | To export these details in CSV format. |
| Manage Users | To manage the users that are accessing the blocked applications. Clicking this button redirects you to the User Management page. |
Applications by Data Transfer
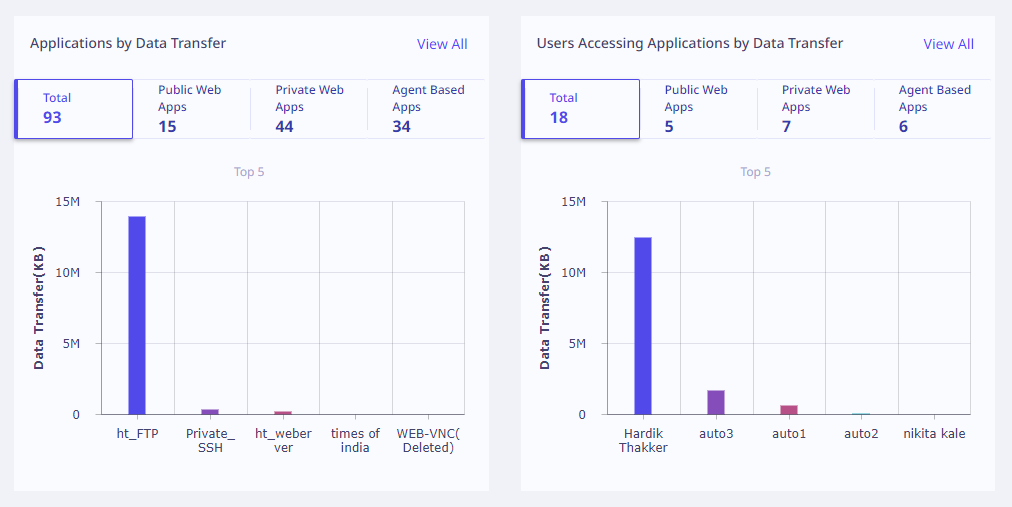
In this chart, a widget at the top display the following information.
| Field | Description |
|---|---|
| Total | Total number of applications. |
| Public Web Apps | Number of public web apps. |
| Private Web Apps | Number of private web apps. |
| Agent Based Apps | Number of agent based apps. |
| Graph | The graphical representation of the data transfer (In kilobytes) for the top 5 applications is displayed. |
Click View All to view the complete information about the applications transmitting data.
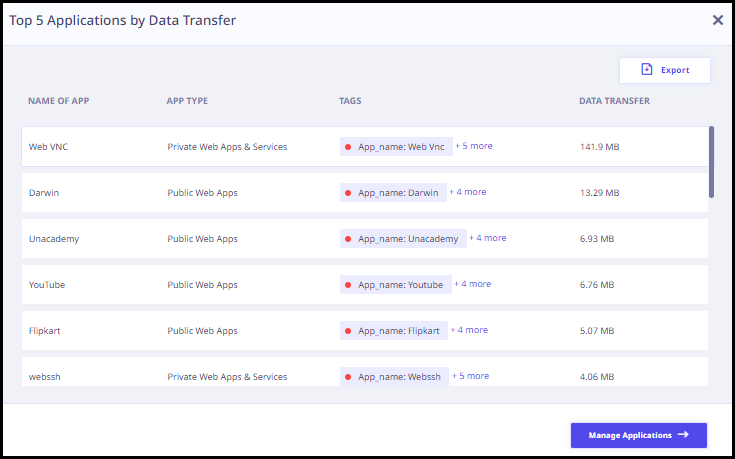
Actions available with applications
| Field | Description |
|---|---|
| Export | To export these details in CSV format. |
| Manage Apps | To manage the applications. Clicking this button redirects you to the Application Catalog page. |
Users Accessing Applications by Data Transfer
In this chart, a widget at the top display the following information.
| Field | Description |
|---|---|
| Total | Total number of users accessing applications. |
| Public Web Apps | Number of users accessing public web apps. |
| Private Web Apps | Number of users accessing private web apps. |
| Agent Based apps | Number of agent based apps. |
| Graph | The graphical representation of the users transmitting data (In kilobytes) for the top 5 applications is displayed. |
Click View All to view the complete information about the users accessing applications by transmitting data.
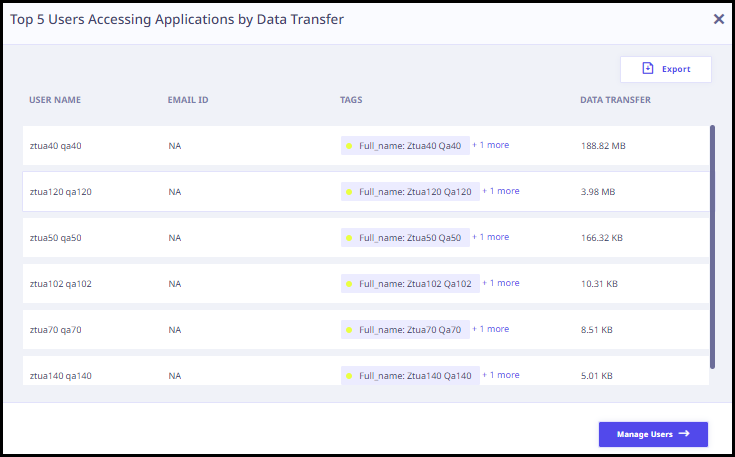
Actions available with users
| Field | Description |
|---|---|
| Export | To export these details in CSV format. |
| Manage Users | To manage the users. Clicking this button redirects you to the User Management page. |
Policies Applied
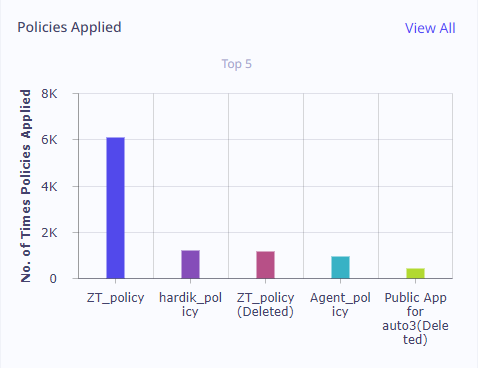
In this section, the graphical representation of the top policies and the number of times they are applied is displayed.
Click View All to view complete information about all the applied policies.
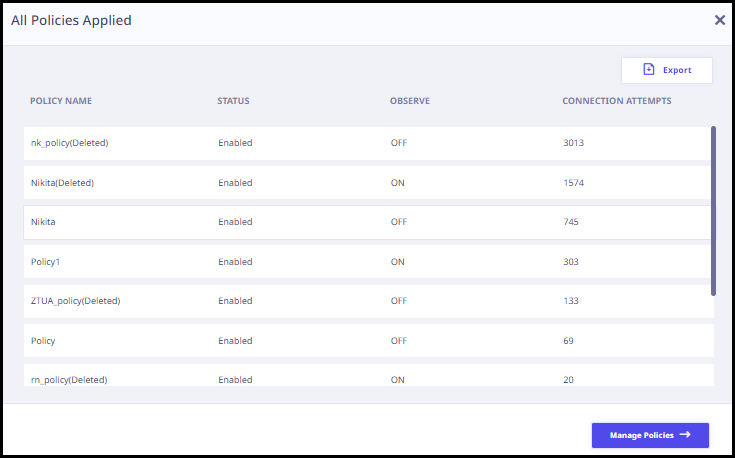
Actions available with policies applied
| Field | Description |
|---|---|
| Export | To export these details in CSV format. |
| Manage Policies | To manage all the applied policies. Clicking this button will redirect you to the Policy Management page. |
The administrator can view the information on this page for various time duration as required by clicking the View drop-down menu in the upper right corner. Now the time duration supports up to last 180 days, under the custom option available in the drop-down.
WAF
To enhance visibility and streamline monitoring of web application firewall (WAF) activity, a new filter has been added to the Dashboard page. This filter allows administrators to view connections that have been blocked for various reasons, including those blocked by the WAF, firewall, device posture check, and more.
A dedicated dashboard has been created to display widgets and statistics specifically related to WAF use-cases. This dedicated dashboard offers the following widgets:
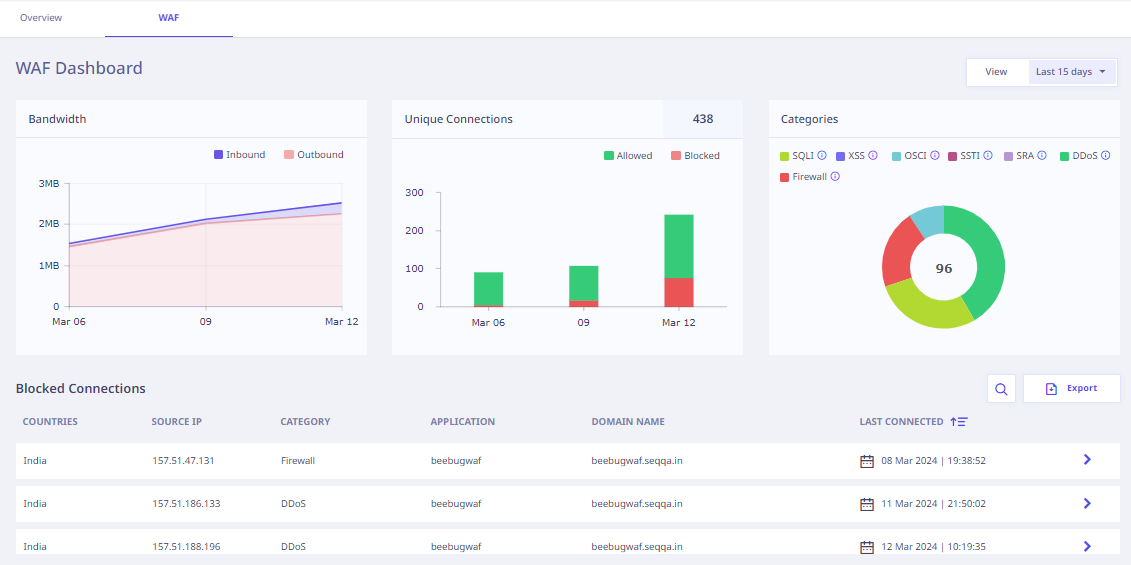
- Bandwidth: The Bandwidth widget provides details regarding both inbound and outbound bandwidth for the specified time frame.
Inbound bandwidth measures the volume of traffic entering the protected applications, including requests, data packets, and other communication.
Outbound Bandwidth measures the volume of data sent from the protected applications to external destinations, such as responses to client requests, files being served, or any other outgoing traffic generated by the applications. - Unique Connections: This widget provides comprehensive insights into connections that are blocked but do not have user authentication policy enforced. Here, you can view the total count of WAF enabled applications along with statistics related to Allowed and Blocked Applications within the specified time period.
- Categories: The Categories widget displays the number of attacks detected while accessing WAF enabled applications. These attacks include SQL Injection (SQLI), Cross-Site Scripting (XSS), OS Command Injection (OSCI), Server-Side Template Injection (SSTI), Server Request Abuse (SRA), Distributed Denial of Service (DDoS), and Firewall related incidents.
Key Features of the Dedicated Dashboard
- Widgets and Statistics
The dedicated dashboard includes various widgets and statistical displays related to WAF use-cases.
- Focus on Unauthenticated Connections
The dashboard highlights connections that are blocked but do not have user authentication policy enforcement, allowing administrators to prioritize security measures.