
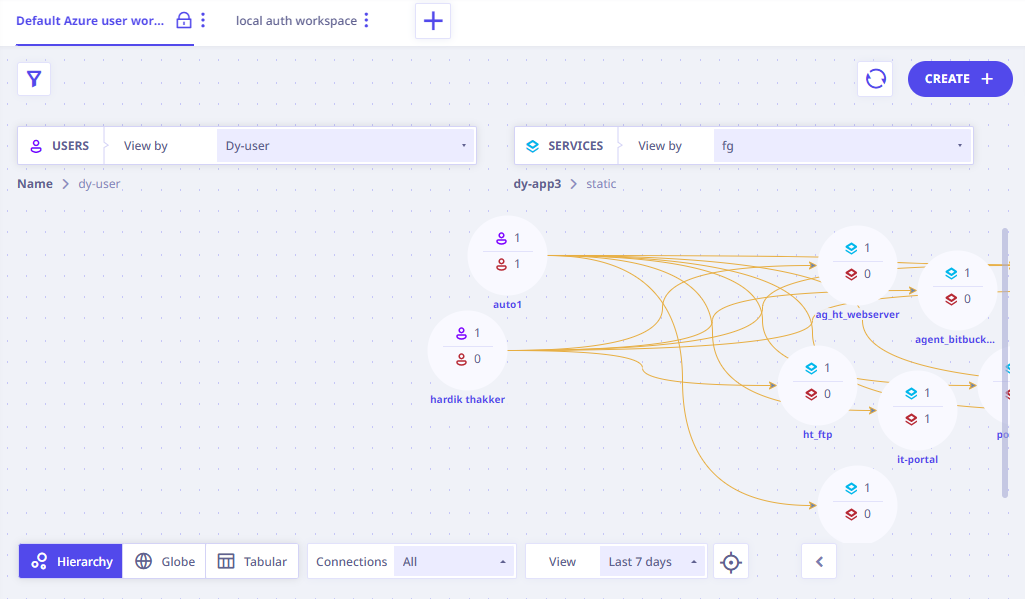
After the onboarding is completed, you are navigated to the Visibility page on the Seqrite ZTNA console. This page displays a pictorial representation of all the network flows between the endpoints and applications and services, and the corresponding connections that have been allowed, observed and blocked.
The Visibility dashboard displays the following information in a hierarchical, Globular, or Tabular view for traffic between business users and enterprise applications.
You can change the displayed view in the following ways by using the desired combination of the options from the lower left footer pane.

- Select the type of view, whether Hierarchical, Globe, or Tabular view.
- Hierarchical view: Displays connection flow between selected user and services/ applications.
- Globe view: In this view, the information is represented in a 3-dimensional interactive format. A globe displays all the attempted connections from one location to another.
When you click any connection line, all the details related to the connection are displayed. Click the caret on upper-right corner to view the details in the right pane.
Note:
User location is displayed as per User’s ISP server location.If the machine on which the app connector is hosted is down due to some reason, then the location of the application is displayed as ‘undefined’.
- Tabular View: Displays the above information in a tabular format.
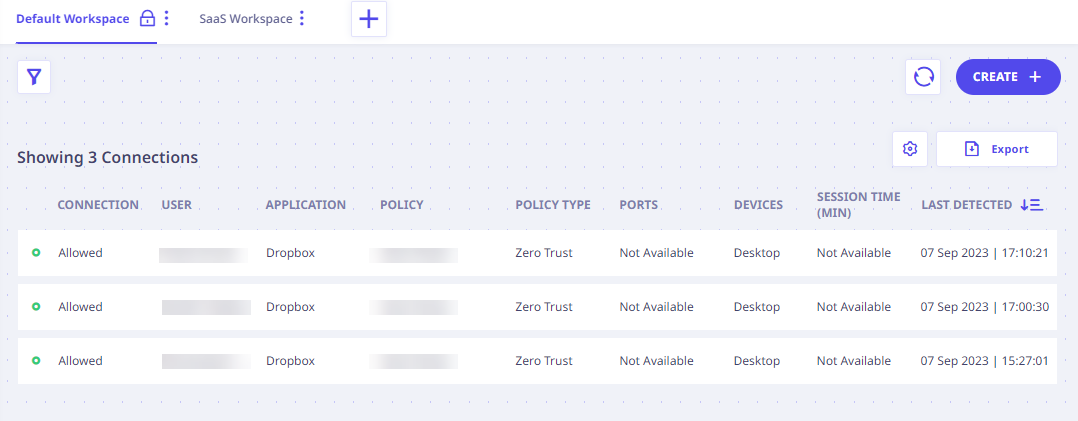
In this view, all the attempted connections to organizational applications are displayed. The following information is displayed for the connections.
Column Name Description Connection Type of connection. User Name of the user who attempted the connection. Application The applications for which connection was attempted. Policy Name of the policies that are applicable for the attempted connection. Click View Details to view more policy details. Policy Type Type of policy. Ports Port number Device The category of devices initiating the connection Session time (Mins) Duration for which the user has accessed this application. Note: For some public web apps, session time is displayed incorrectly.
Last Detected Date and time when the connection was last detected. - Select connection types from allowed, blocked, observed, or for all connections.
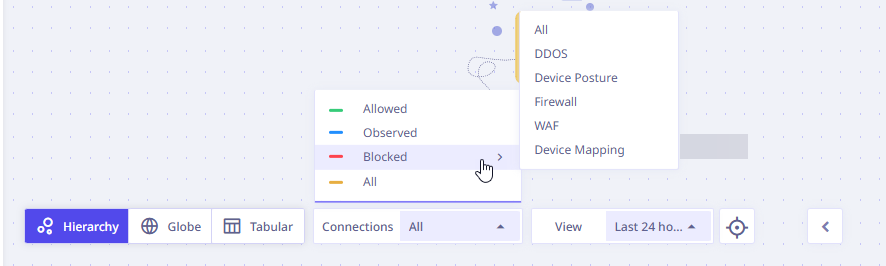
- Allowed: These are the connections that have been allowed by Seqrite ZTNA based on existing policies and tags.
- Observed: Some connections are allowed but need to be monitored as required. Such connections can be marked as Observed.
- Blocked: These are the connections that have been restricted by Seqrite ZTNA in accordance with existing DDoS policies, Device Posture Compliance, Firewall, WAF, and Device Mapping Criteria.
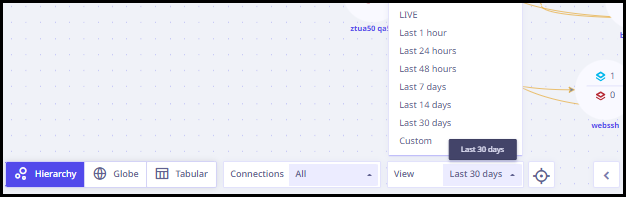
- Duration – Shows flow for selected users and services, whether from Live or from historical data as selected. Now the custom duration selection supports upto last 180 days visibility.
- Re-center – Use this button to re-center the view.
- Hide the options in the footer pane by clicking the backward arrow (<) button and restore the options by clicking the forward arrow (>) button that is displayed.
- In the upper right corner, the following options are given.
- Refresh: To refresh the information on the page.
- Export: To export the information on the page in CSV format.
Navigating the Visibility options
You can search through or filter the network flows and events on the visibility dashboard as required by selecting a combination of the Users and Services hierarchy.
Hierarchy
Hierarchy is a series of entities arranged in a particular sequence based on requirement. You can create multiple hierarchies for users using hierarchy tags available in Seqrite ZTNA.
A hierarchy is a systematic segregation of users and services/applications based on the hierarchy tags such as Department, Location, Role, Environment etc.

Users
This represents the users and user groups that attempt the connections to various applications and services. These users and user groups are arranged in the form of a hierarchy. A default hierarchy is created at the time of onboarding. You can create more hierarchies as required.
You have the following options for Users.
- View traffic flow for the existing hierarchies as selected. The network traffic connections view on Visibility page is updated as per the selection of hierarchy.
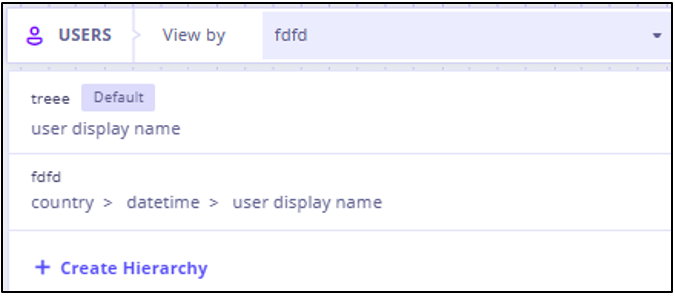
- Create a new user hierarchy by clicking the Create Hierarchy button and selecting the required tags.
Services
You can create hierarchies for services and applications accessed by users.
You have similar options for Services.
- View traffic flow for existing hierarchies of Services as selected. The network traffic connections view on Visibility page is updated as per the selection of hierarchy.
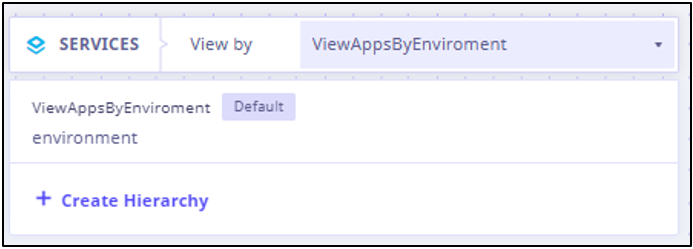
- Create a new hierarchy for Services by clicking the Create Hierarchy button and selecting the required tags.
Viewing information for users or services
The users and applications are displayed pictorially based on the selected hierarchy tags for that particular level. Users and sites are represented by the circles below which the label name (For example – Atlanta for location) is also mentioned. You can drag and move the sites as required. The corresponding traffic connection flows are updated accordingly.
The circles represent different entities in an organization based on the selected hierarchy level. For both Users and Services, a maximum of 6 hierarchies (1 default and 5 custom) can be created.
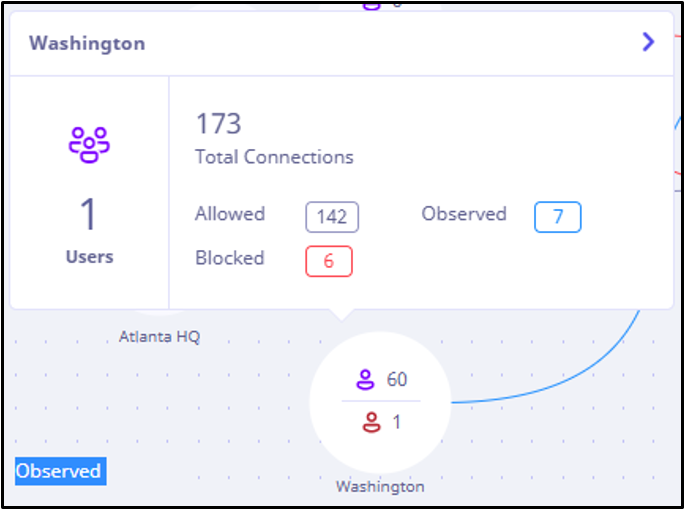
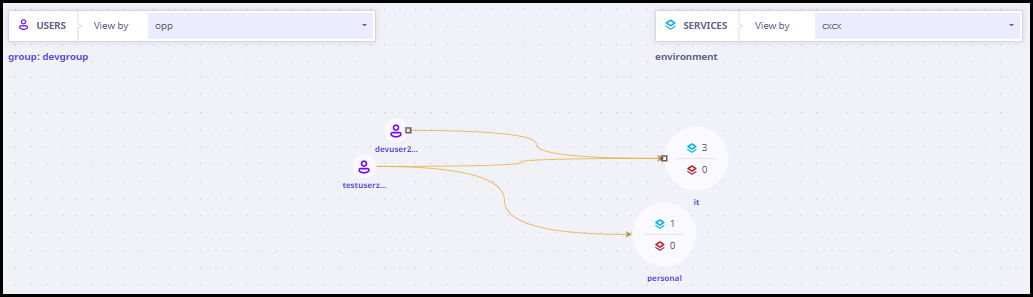
Viewing information for users
Each circle displays the number of users/ services that were part of the attempted connections. The numerator displays the number of users for whom connection was allowed and/or observed. The denominator displays the users whose connection attempts were blocked. Click a circle to view additional information:
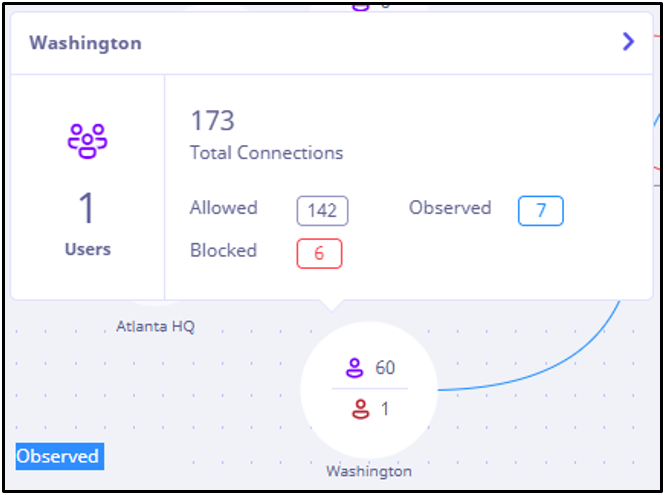
- Label name: Label name of the selected hierarchy level.
- Users: Total number of users.
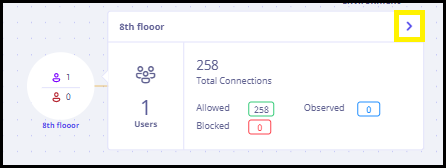
- Total connections: Total number of attempted connections.
- Count of different types of connections: A segregated count of Allowed, Observed and Blocked connections.
Viewing information for services and applications
Each circle displays the number of users/ services that were part of the attempted connections. The numerator displays the number of users for whom connection was allowed and/or observed. The denominator displays the users whose connection attempts were blocked. Click a circle to view additional information for the services and applications:
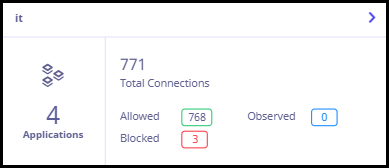
- Label name: Label name of the selected hierarchy level.
- Total connections: Total number of attempted connections.
- Count of different types of connections: A segregated count of Allowed, Observed and Blocked connections.
- Applications: Total number of applications accessed.
Create
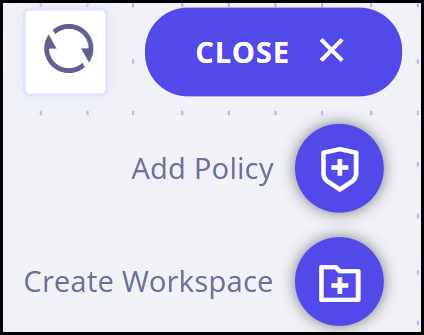
Using the CREATE button in upper right corner, you can perform the following actions.
- Add Policy
- Create Workspace
Next to this, a Refresh button is given. You can refresh the existing data on the screen using this button.
Creating a Hierarchy
To create a hierarchy, follow these steps.
-
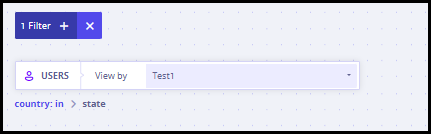
Go to the Hierarchy view in Seqrite ZTNA. In the upper left corner, there is a USERS tab as shown in the following image.
- In the drop-down menu, default hierarchy is already selected. When you click this space, all the existing hierarchies are displayed.
- Click Create Hierarchy.
- Enter hierarchy tags as required. You can add more tags by clicking the Add Hierarchy Tag button.
- After this is done, click Next.
Note:
You can add and use a maximum of 6 hierarchy tags for each hierarchy. A maximum of 6 hierarchies (1 Default and 5 Custom) can be created in one workspace.
Comprehensive Information
You can get further information about the users and applications, when you click the forward caret (>) as shown in the following image:
Visibility Right Panel
Depending on the level you’re at, Seqrite ZTNA displays consolidated connection information in the right panel. You can view this information by clicking the individual connection lines, users, user groups and applications/ services as required.
Viewing Connection Information
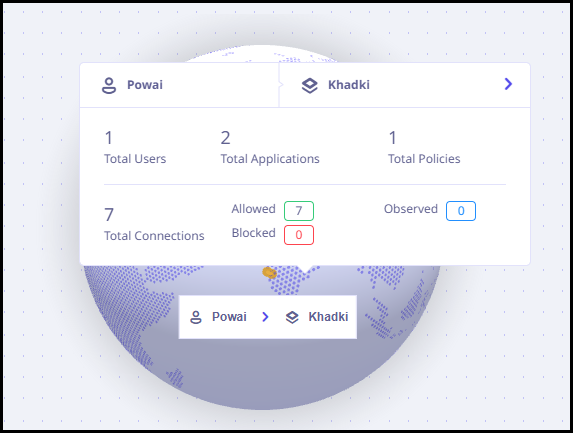
When you click the connection line joining users and applications in Hierarchy and Globe view, a window displays detailed information about that connection. By clicking the caret (highlighted in yellow box), the right panel appears.
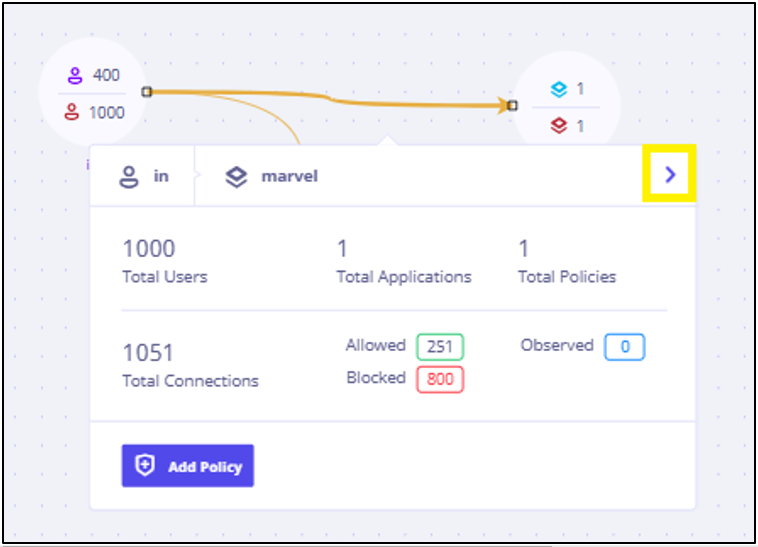
In this right panel, detailed information about the connection and other details are displayed as follows.
Insights
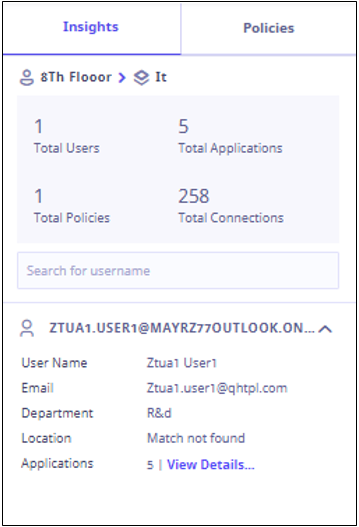
- Label name on user and application side.
- A count of Total users, applications, applicable policies, and connections.
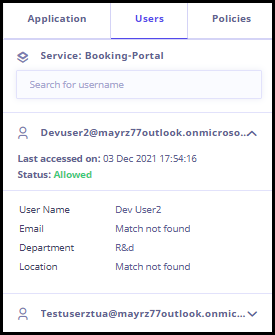
- User details. This will display the list of connected users and you can search by usernames using the search box. The following details are listed for the displayed users.
| Detail | Description |
|---|---|
| User Name | Username as available in the organizational directory. |
| Email address of the user. | |
| Department | Organizational department of the user. |
| Location | Geographical location of the user. |
| Applications | The count of applications the user has attempted. |
Click View Details to view the application details.
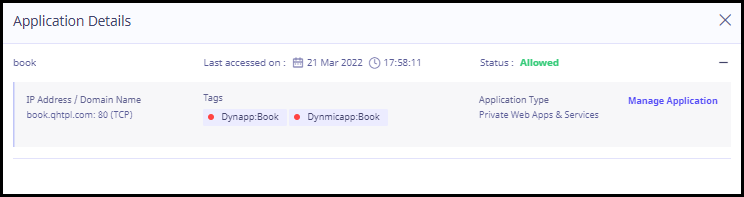
| Column | Description |
|---|---|
| Application name | Name of the application. |
| Last Accessed On | The latest date and time on which the user accessed this application. |
| Status | Status of the connection. |
| Plus sign (+) | View more details about the application related to the Address/ URL, applicable tags, application type. Click Manage Application button to navigate to the Edit Application page. |
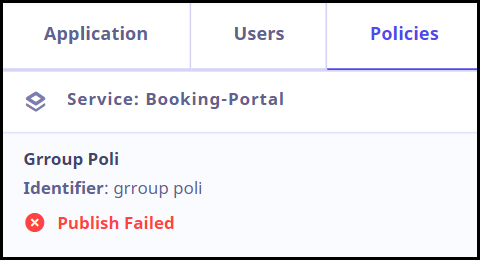
Policies
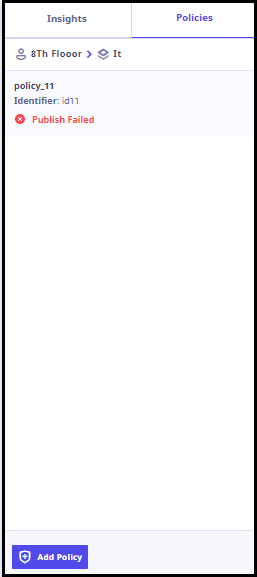
The following details of policies applicable to the connections are displayed in this tab.
| Details | Description |
|---|---|
| Policy name | Name of the policy. |
| Policy identifier | Policy identifier for that policy. |
| Policy status | Status of this policy. |
| Edit Policy | Hover over the policy information to view edit policy icon. Click the pencil icon to edit the policy. |
| Add Policy | To add new policy as required. |
Viewing Connection Information For Users
If you want to view the details of applications accessed by a user and policies applied to those connections, follow these steps.
- Log on to Seqrite ZTNA portal. Navigate to Visibility page in the left pane. Hierarchy view is displayed. On this page, apply the hierarchy of your choice to users and services.
- Click a user group. A window opens as shown in the following image. Click the caret (Highlighted in yellow).
Now the user hierarchy is at granular level and you can view the individual users in that user group.
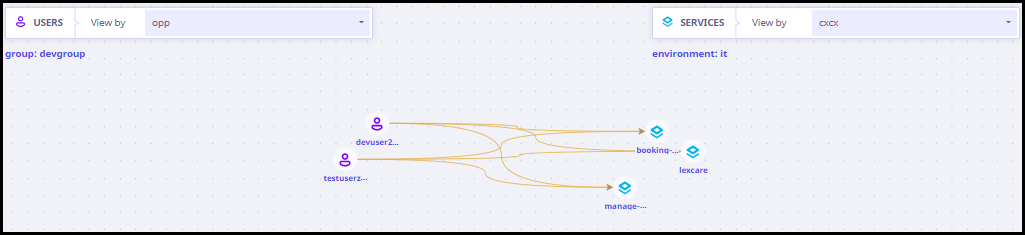
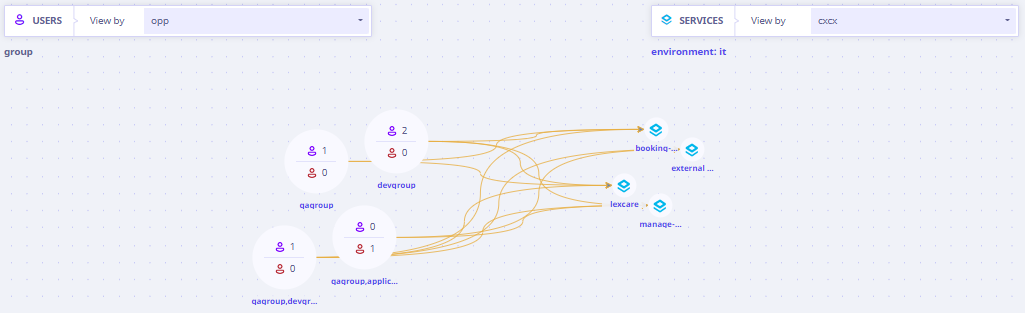
- Top-down hierarchical view:
As shown in the following image, user is at granular level and application/ services are at group level.
- Granular view:
In the following image, both users and applications/ services are at granular level.
When an administrator clicks a user in these views, a pop-up window opens as shown in the following image.
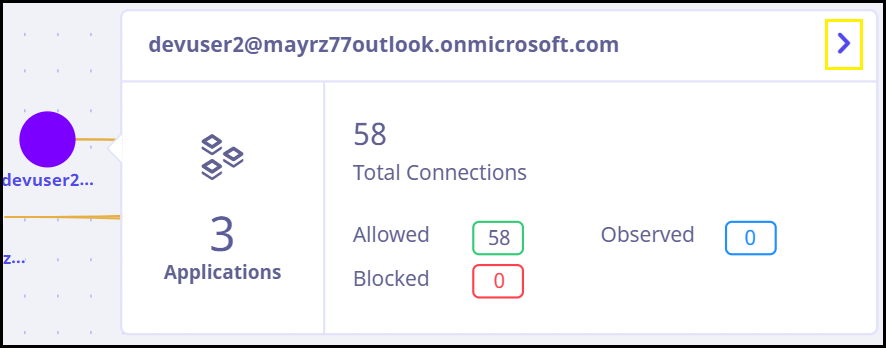
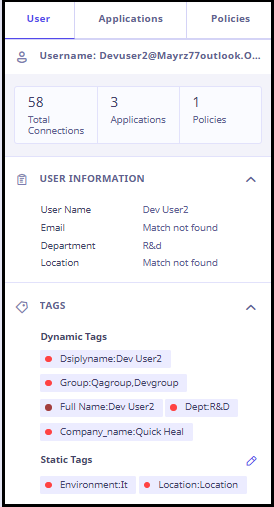
Click the caret (Highlighted in a yellow box) to view the following details in the right pane. The user name is displayed at the top across the following tabs.
Users
| Fields | Description |
|---|---|
 |
|
Applications
| Fields | Information |
|---|---|
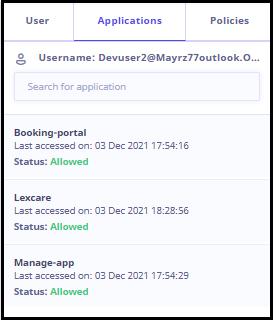 |
A list of applications to which user attempted a connection is given in this tab. The following details for each application are displayed.
|
Policies
| Fields | Information |
|---|---|
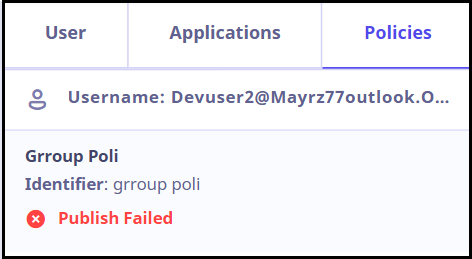 |
|
Viewing Connection Information For Applications/ Services
If you want to view the details of users or user groups that accessed any applications/ services and policies applied to those connections, follow these steps.
- Log on to Seqrite ZTNA portal. Navigate to Visibility page in the left pane. Hierarchy view is displayed. On this page, apply the hierarchy of your choice to users and services.
- Click an application/ services group. A window opens as shown in the following image. Click the caret (Highlighted in yellow box).
Now, the applications/ services hierarchy is at granular level and you can view the individual applications/ services in that group.
As shown in the following image, users are at group level. The applications/ services are at granular level.
When an administrator clicks an application/ service in the above mentioned views, a pop-window opens as shown in the following image.
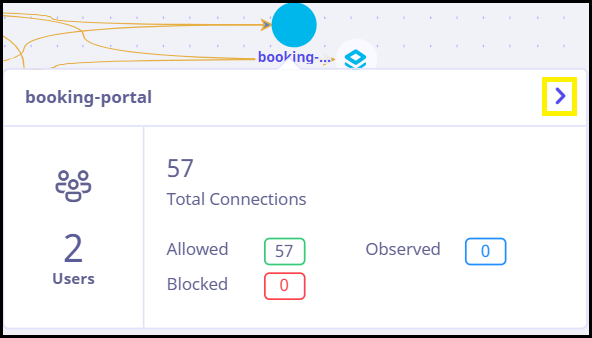
Click the caret (Highlighted in a yellow box) to view the following details in the right pane. The application/service name is displayed at the top across the following tabs.
Application
| Fields | Information |
|---|---|
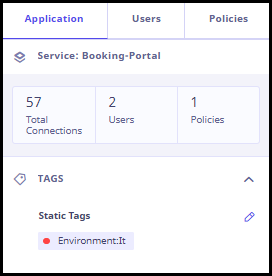 |
|
User Groups/ Users
| Fields | Information |
|---|---|
 |
|
Policies
| Fields | Information |
|---|---|
 |
|
Adding a filter to refine the view
A filter option is given in the upper left corner. You can add multiple filters to filter through the available information about connections from users to applications/ services. To apply a filter, click Add Filter(s) button. A pop-up window appears.
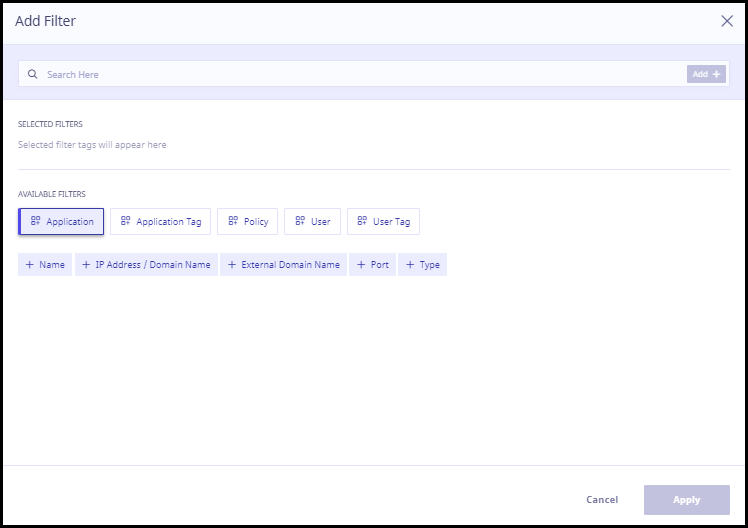
You can select the filter from either search box or from the filter tiles given in Available Filters section.
- When you click the search box, a list of all the available filters is displayed. Click and select the required filter.
- Now, select the operator as required. The following list of operators is available.
| Sr. No. | Filter Expression Name | Value after selecting expression |
|---|---|---|
| 1 | Equals | Value to be selected from available options. |
| 2 | Not Equals | Value to be selected from available options. |
| 3 | Contains | One word free text value functionality is supported. |
| 4 | Starts With | One word free text value functionality is supported. |
| 5 | Ends With | One word free text value functionality is supported. |
After this is done, press the spacebar.
- Select an option from the list that appears or enter free text as required based on the selected operator.
- Now, click Add.
The filter appears in the Selected Filters section.
- After this is done, click Apply.
Now, you will see only those connections that fulfill the filter conditions. You can again click the Add Filter button to edit the existing filters or add new ones.
You can also apply brackets to the filters. Brackets prioritize a filter over other filters.
Example 1
Explanation
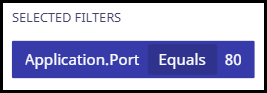
Let us apply a filter to view connections involving application port number 80.
- Click Add Filter(s).
- In the search box, click and select the filter name ‘Application.Port’ and press spacebar. A list of mathematical operators is displayed.
- From the list of mathematical operators, select ‘Equals’ and press spacebar. A list of applicable values is displayed.
- From the list of values, select 80.
- Click Add.
- After this is done, click Apply.
Connections involving application port number 80 will be displayed.
Example 2
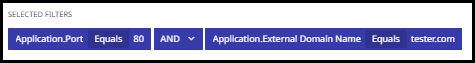
Let us apply a filter to view connections involving application port 80 and application external domain name tester.com .
- Click Add Filter(s).
- In the search box, click and select the filter name ‘Application.Port’ and press spacebar. A list of operators is displayed.
- From the list of operators, select ‘Equals’ and press spacebar. A list of applicable values is displayed.
- From the list of values, select 80.
- Press spacebar. A list of operators appears.
- Select AND and press spacebar.
- Click and select the filter name ‘Application.External Domain Name’ and press spacebar. A list of operators is displayed.
- From the list of operators, select ‘Equals’ and press spacebar. A list of applicable values is displayed.
- From the list of values, select tester.com.
- Click Add. Then click Apply.
Connections involving application port number 80 and application external domain name tester.com will be displayed.
Note:
After applying, a filter will remain active through all the views i.e. Hierarchy, Globe and Tabular. If you go on other pages and come back on Visibiilty page, the filter will still remain active.
The added filters appear in the Selected Filters section. When you hover over these filters, you see the following options.
| Action Icon | Action Label | Description |
|---|---|---|
 |
Edit | To edit the filter. |
 |
Delete | To delete the filter. |
You need to manually remove the filters by clicking Clear Filters option in the Add Filter window. You can also click the cross symbol on the Add Filter button in upper left corner and remove the filter as shown in the following image.
You can add multiple filters at once by using the AND and OR condition operators. A maximum of 12 filters can be applied.
Workspace
A user can create workspaces to list similar hierarchies together. You can create multiple workspaces as per requirement. There is also a provision to edit and duplicate an existing workspace.
In the middle section, connections for selected hierarchies is displayed.
Create Workspace
To create a new workspace, follow these steps:
- Log on to the Seqrite ZTNA portal.
- Click the plus sign (+) in the upper left corner next to the Default Workspace section or the latest created workspace.
- A pop-up window appears. Enter the workspace name and click Create.
The new workspace will be displayed now. The default hierarchy is available in this workspace. The user can create more hierarchies if they wish to. You can also create a new workspace by clicking on the Create button in upper right corner.
Note:
No existing custom hierarchy will be copied when you create a new workspace.
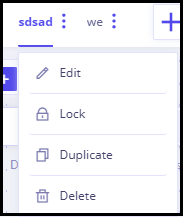
There is a three-dot menu next to the workspace name which has the following options.
- Edit: To edit the workspace.
- Lock: To lock/unlock the workspace.
- Duplicate: To create a copy of the workspace.
- Delete: To delete the workspace.
A maximum of 4 workspaces can be created including the default workspace.