The data on this page is consolidated, data of the main server and data of all the secondary servers.
If the EPS server is not connected to any Secondary Server, Consolidated Dashboard page is not visible.
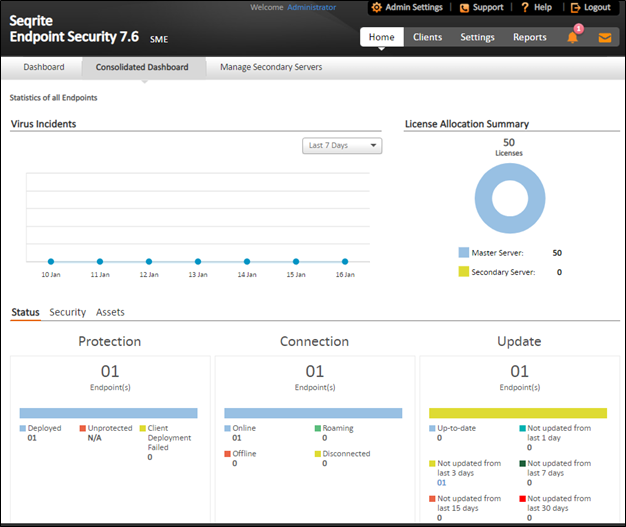
Virus Incidents
| Feature |
Description |
| Virus incidents |
Gives a graphical representation of the virus incidents for the selected time period. The graphs can be viewed for the following time periods: · Past 7 Days: Displays the report of the last seven days. · Past 15 Days: Displays the report of the last 15 days. · Past 30 Days: Displays the report of the last 30 days. This status is displayed over a 4-level grid by colored dots that are in ascending level with green at the lowest level and red at the highest level. These colored dots indicate the following: · Green (Normal): Indicates endpoint is not infected and is secure. · Yellow (Elevated): Indicates low level of endpoint infection. · Orange (High): Indicates high level of endpoint infection that requires immediate action. · Red (Critical): Indicates critical level of endpoint infection that requires immediate action. The Virus Incidents summary does not change if the client is removed or uninstalled after the incident. |
License Allocation Summary
| Feature |
Description |
| License Allocation Summary |
Gives a doughnut chart which displays the total number of licenses held by the Master Server and the Secondary Servers. |
Status
| Feature |
Description |
| Status Tab |
Displays the information for the following categories: · Protection · Connection · Update |
| Protection |
Displays the number of endpoints deployed in the network, unprotected endpoints across your network, and the endpoints on which deployment of any client has failed. |
| Connection |
Displays the total number of connections registered to the system with the break-up for online, offline, disconnected, and roaming endpoints. It also displays information about offline, disconnected, roaming endpoints, and when they were last connected to the computer. |
| Update |
Displays the number of endpoints on which the virus definitions are not updated from last 1, 3, 7, 15 and 30 days. Click the number under the category. An update Status dialog appears showing a list of the Endpoint name, Domain, IP address, and Virus Database date. You can select the number of days to view the list of endpoints which are not updated. This filter helps you to select in between days of the categories. This status can be exported in the csv format. |
Security
| Feature |
Description |
| Security Tab |
Displays the protection status for the following for last 7, 15 and 30 days: · Virus protection · Phishing protection · Browsing Protection |
| Web Security |
Displays the information for top 5 Web site categories, which were blocked in past 7 days in graph and a list of the top 5 Web sites, which were blocked in past 7 days in a table with URL, Type, and Count columns. Note: This feature is optional and will be visible only if you have purchased the license for Web Security feature. For more information, see Web Security. |
| Data Loss Prevention |
Displays the number of data leak attempts over the last 7 days and a list of the top users who were trying to leak the data. Note: This feature is optional and will be visible only if you have purchased the license for DLP feature. For more information, see Data Loss Prevention. |
| Vulnerabilities |
Displays the number of affected endpoints and severity level in the percentage format. It also displays a graphical widget for Vulnerability Severity. A link View details helps you to view Vulnerability Severity details. |
| Patch Management |
Displays the number of missing patches by severity. |
Assets
| Features |
Description |
| Platforms |
Displays the total number of endpoints installed on a platform. Click the columns in the bar graph to display extended information related to a specific category. The endpoint IP address is displayed along with the platform on which it was installed. Note: This feature is applicable to all endpoints for Windows, Linux, and MAC operating systems. |
