
The Dashboard area on the Home page has widgets for the following.
Overview
| Feature | Description |
|---|---|
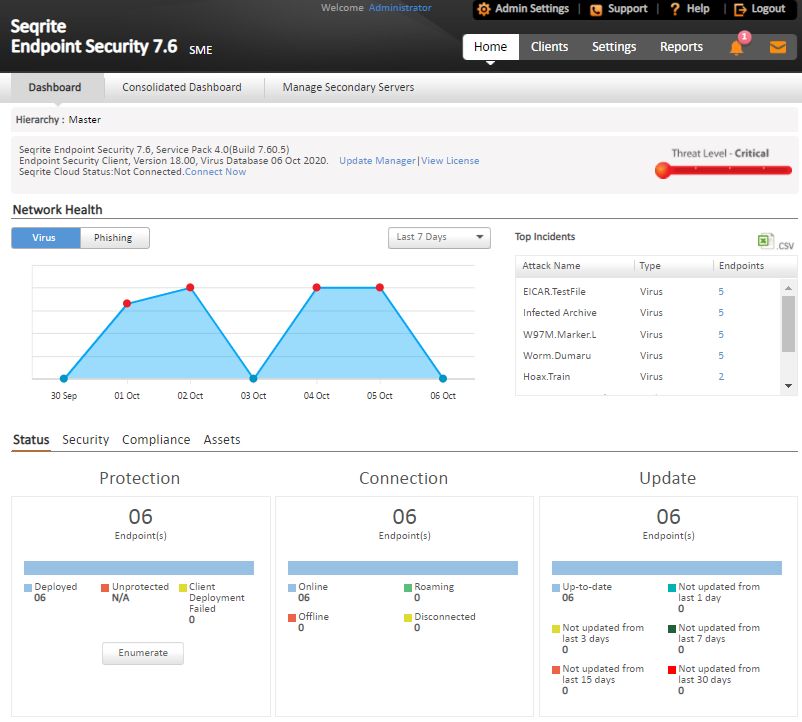
| Hierarchy | On the Master server, “Hierarchy” name will be represented as “Master”. On the Secondary Server, displays the hierarchy of the Server you have logged on. This shows the names of the parent servers up to Master. Example: Master / Primary001 / Secondary020. In this case, the logged-on Server name is Secondary020 and the parent Server is Primary001, which is reporting to the Master. |
| Product version | Displays the product version along with the build number. The build number is useful for troubleshooting purposes. The SEPS service pack information is also available. The virus database date included helps in understanding if your version is updated or whether it needs updates. |
| Update Manager | Link for running the Update Manager. For more information, see Update Manager. |
| View license | Displays the links for: · Status: Displays currently held licensee information, installation number, product key, product type, validity and the maximum number of the Endpoints permitted. · License order form: Displays the License order form to order new feature/license. · License History: Displays the license history details. |
| Seqrite Cloud Status | Displays whether the EPS server is connected or not connected to the cloud. If not connected, use the Connect Now link if required. Seqrite Cloud is a different product and is only available for the users who have purchased it additionally. |
| Threat Level | Displays current threat level of your network. The threat levels include: – Normal: Indicates that 12% of the endpoints detected viral infection in last 24 hours. · Elevated: Indicates that 24% of the endpoints detected viral infection in last 24 hours. · High: Indicates that 36% of the endpoints detected viral infection in last 24 hours. · Critical: Indicates that more than 36% of the endpoints detected viral infection in last 24 hours. Important: Thorough scanning of the entire network is recommended if the threat level alert is High or Critical. |
| Alert | An alert appears if the health of the network needs an immediate action. Click the More link to see all the alerts. (The More link is displayed only if multiple alerts are available.) You can take appropriate action to fix the issue. |
| Seqrite Encryption Manager | Displays the name of Seqrite Encryption Manager with version. Click the View Console link to access the Seqrite Encryption Manager console. |
Network Health
| Feature | Description |
|---|---|
| Network Health | Graphical representation of the network health for the categories of Virus and Phishing. Click the respective tab to get the details of that category. It shows how secure your system is currently. This status is displayed over a 4-level grid by colored dots that are in ascending level with green at the lowest level and red at the highest level. These colored dots indicate the following: · Green (Normal): Indicates endpoint is not infected and is secure. · Yellow (Elevated): Indicates low level of endpoint infection. · Orange (High): Indicates high level of endpoint infection that requires immediate action. · Red (Critical): Indicates critical level of endpoint infection that requires immediate action. The right pane carries a table with Top Attacks, the type and the total number of endpoints affected. |
| View for drop down list | Gives a graphical representation of the network health for the selected time period. The graphs can be viewed for the following time periods: · Past 7 Days: Displays the report of the last seven days. · Today: Displays the report of the today’s infection. · Past 15 Days: Displays the report of the last 15 days. · Past 30 Days: Displays the report of the last 30 days. |
| Top Incidents | Displays the top 10 incidents on computers by Attack Name, type, and number of endpoints infected. Clicking on the endpoint count, opens a window with details of the actual endpoint infected. You can save the top incidents report of Virus and Phishing in the csv format. If the client is removed or uninstalled after the incident, the updated Endpoint count is reflected after next Client-Server communication cycle. |
Status
| Feature | Description |
|---|---|
| Status Tab | Displays the information for the following categories: · Protection · Connection · Update |
| Protection | Displays the number of endpoints deployed in the network, unprotected endpoints across your network, and the endpoints on which deployment of any client has failed. |
| Connection | Displays the total number of connections registered to the system with the break-up for online, offline, disconnected, and roaming endpoints. It also displays information about offline, disconnected, roaming endpoints, and when they were last connected to the computer. |
| Update | Displays the number of endpoints on which the virus definitions are not updated from last 1, 3, 7, 15 and 30 days. Click the number under the category. An update Status dialog appears showing a list of the Endpoint name, Domain, IP address, and Virus Database date. You can select the number of days to view the list of endpoints which are not updated. This filter helps you to select in between days of the categories. This status can be exported in the csv format. |
| Enumerate | Click Enumerate to generate a list of all the unprotected endpoints connected to the network. Note: This may take some time and a link to a list of all these endpoints with their endpoint name, domain name, and operating system platform name will be displayed. |
Security
| Feature | Description |
|---|---|
| Security Tab | Displays the protection status for the following: · Virus protection · Phishing protection · Browsing Protection |
| Web Security | Displays the information for top 5 Web site categories, which were blocked in past 7 days in graph and a list of the top 5 Web sites, which were blocked in past 7 days in a table with URL, Type, and Count columns. Note: This feature is optional and will be visible only if you have purchased the license for Web Security feature. For more information, see Web Security. |
| Data Loss Prevention | Displays the number of data leak attempts over the last 7 days and a list of the top users who were trying to leak the data. Note: This feature is optional and will be visible only if you have purchased the license for DLP feature. For more information, see Data Loss Prevention. |
| Vulnerabilities | Displays the number of affected endpoints and a comparative list of the top vulnerabilities, severity level, and the total number of vulnerabilities detected. Also, displays a graphical widget for the listed data. |
| Patch Management | Displays the number of missing patches by severity. In Patch scan overview section, you can view status of patch scan for the selected date. Select the date from the calendar and click Submit. This gives a doughnut chart which displays the number of endpoints with missing patches, endpoints not scanned, and up to date Endpoints. The Number of endpoints with missing patches as per application family section gives a doughnut chart which displays the number of endpoints with missing patches of top 5 application families. Clicking the count, opens a window with details of patch scan result. |
Compliance
| Feature | Description |
|---|---|
| Advanced Device Control | Displays the information for top device types that breached the policies in the past 7 days and a list of top 5 users, who breached the policy, specifying their user name, endpoint name, and the count of breaches. |
| Application Control | Displays the information for top applications that were blocked in the past 7 days and a list of top 5 users who attempted to access the blocked applications specifying their user name, endpoint name, and count. |
Assets
| Feature | Description |
|---|---|
| Hardware changes | Displays the number of hardware changes detected on SEPS 7.6 endpoints. |
| Software changes | Displays the number of software changes detected on SEPS 7.6 endpoints. Clicking the count, opens a window with details of software changes, i.e. Software installed, uninstalled and updated. |
| Platforms | Displays the total number of endpoints installed on a platform. Click the columns in the bar graph to display extended information related to a specific category. The endpoint IP address is displayed along with the platform on which it was installed. |
| Software Installed | Displays the number of endpoints on which software have been installed. This display is also in the form of a bar graph which can be toggled to display the number of software least installed v/s the number of software most installed. Click the columns in the bar graph to display more information related to the category. The endpoint IP address is displayed along with the software name. |
CTA Banner – GoDeep.AI
A Call to Action (CTA) banner of GoDeep.AI is displayed in the footer of the page. GoDeep is Artificial intelligence (AI) enabled Deep Predictive Malware Hunting Technology using Advance Machine Learning. Click KNOW MORE on the banner for more information.